
Figure 3.
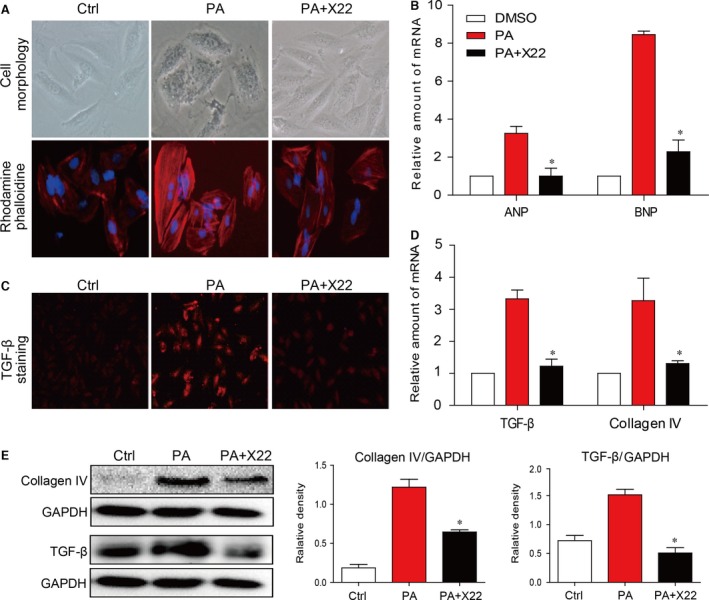
X22 attenuated PA‐induced cardiac hypertrophy and fibrosis in H9C2 cells. (A and B) X22 reduces hypertrophy. H9c2 cells were pretreated with X22 (20 μM) for 1 hr and then incubated with PA (500 μM) for 6 hrs. (A) Representative images for cell morphology analysis were obtained using light microscopy and rhodamine‐phalloidin/DAPI immunofluorescence staining; n = 3 separate determinations. (B) Real‐time RT‐qPCR analysis for pro‐hypertrophic genes expression. (C–E) X22 reduces fibrosis. H9c2 cells were pretreated with X22 (20 μM) for 1 hr and then incubated with PA (500 μM) for 12 hrs. (C) Immunofluorescence staining for TGF‐β in the cells was performed as described in ‘Materials and methods’; n = 3 separate determinations. (D) Real‐time RT‐qPCR analysis for pro‐fibrotic genes expression. (E) Shown are representative Western blot analysis for expression of pro‐fibrosis proteins; n = 3 separate determinations. For real‐time qPCR assay, data are reported as the mean ± S.E. (*P < 0.05; n = 4 of all experiments).