
Figure 8.
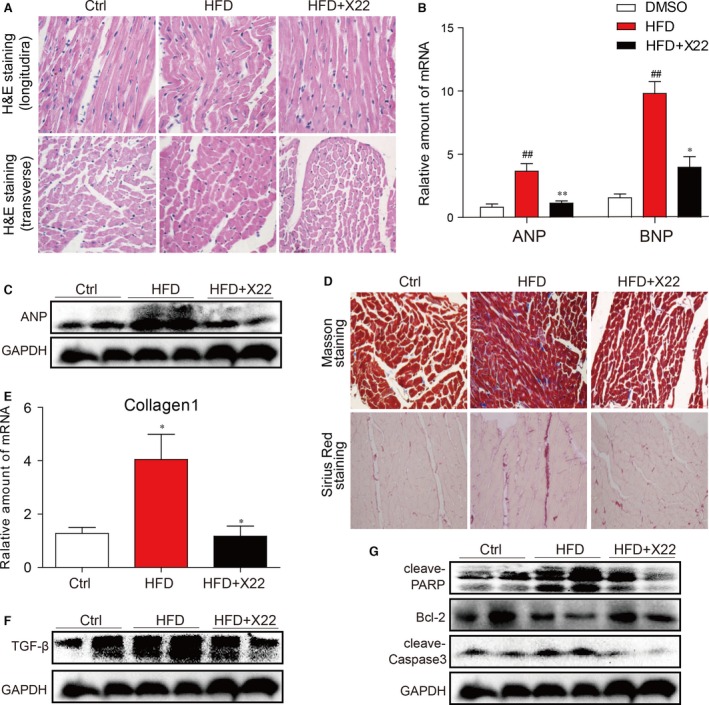
X22 decreased HFD‐induced cardiac remodelling (A–C), fibrosis (D–F) and apoptosis (G) in HFD‐fed rats. (A) Representative images for the haematoxylin and eosin staining in the formalin‐fixed myocardial tissues (400× magnification). (B) The mRNA expression of the hypertrophic markers ANP and BNP in the myocardial tissues. (C) The Western blot analysis for the protein expression of ANP in the myocardial tissues. (D) Representative images for the Masson staining and Sirius Red staining in the formalin‐fixed myocardial tissues (400× magnification). (E) The mRNA expression of the fibrosis marker collagen I in the myocardial tissues. (F) The Western blot analysis for the protein expression of TGF‐β in the myocardial tissues. (G) The Western blot analysis for the protein expression of cleaved‐PARP, cleaved‐caspase3 and Bcl‐2 in the myocardial tissues (#, versus DMSO samples; *, versus HFD samples; # and *P < 0.05, ## and **P < 0.01, n = 7 per group).