Figure 2.

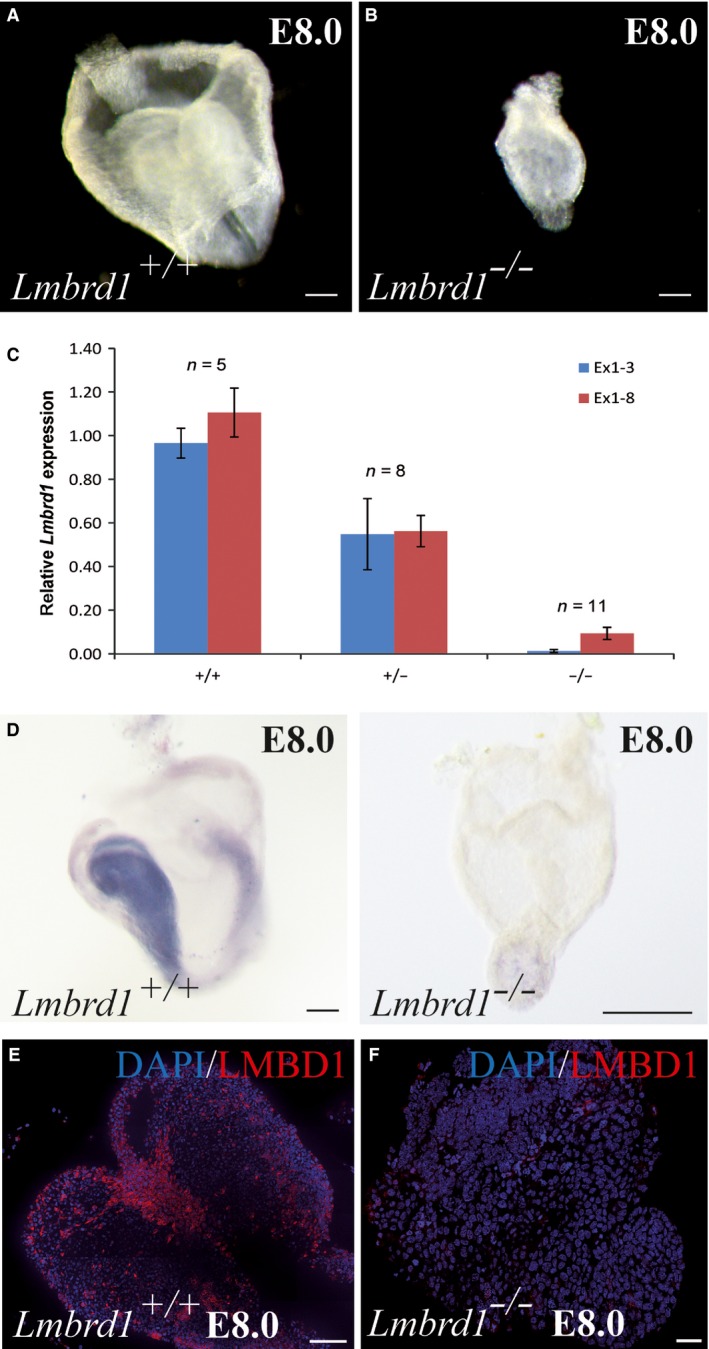
Loss of Lmbrd1/ LMBD1 leads to early embryonic lethality. (A and B) Lmbrd1 −/− ‐ mutant embryos show developmental delay compared to wild‐type littermates. Scale bars represent 100 μm. (C and D) Homozygous deletion of Lmbrd1 exon 3 leads to loss of Lmbrd1 expression in mutant embryos demonstrated by real‐time PCR and whole mount in situ hybridization. Scale bars represent 100 μm. (E and F) Immunofluorescence whole mount staining of E8.0 embryos confirmed loss of LMBD1 protein compared to wild‐type littermates. LMBD1 is shown in red and nuclei in blue; scale bars represent 50 μm. Representative embryos are shown (n = 5).
