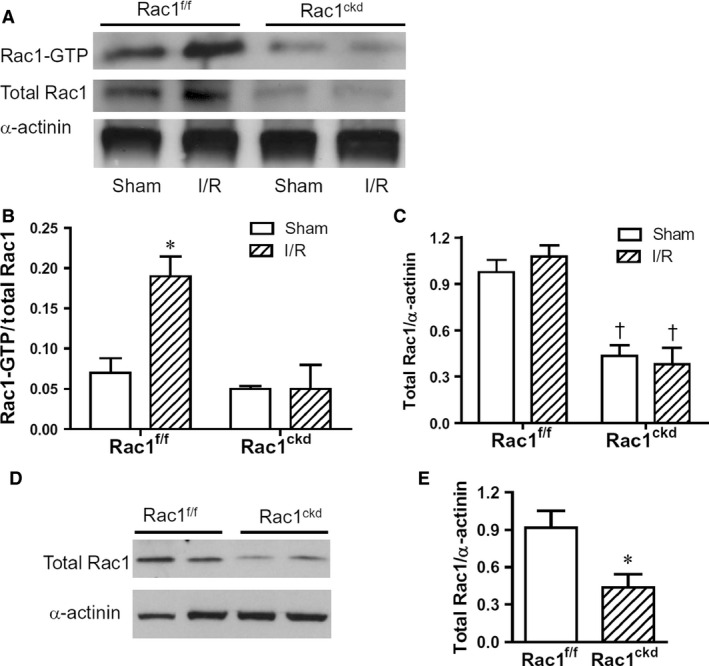
Figure 1.

Myocardial Rac1 activity after I/R. (A) Representative Western blots of Rac1‐GTP with α‐actinin as loading control in Rac1f/f and Rac1ckd hearts after myocardial I/R. (B) Quantification of Rac1 activity using Rac1‐GTP to total Rac1 protein ratios. (C) Quantification of total Rac1 to α‐actinin protein ratios in the heart. (D) Representative Western blots of total Rac1 and α‐actinin proteins in isolated cardiomyocytes from adult Rac1f/f and Rac1ckd mice. (E) Quantification of total Rac1 to α‐actinin protein ratios in the isolated cardiomyocytes. Data are mean ± SEM from three to four mice per group. * P < 0.05 versus Rac1f/f sham in B or Rac1f/f in E, †P < 0.05 versus respective Rac1f/f.
