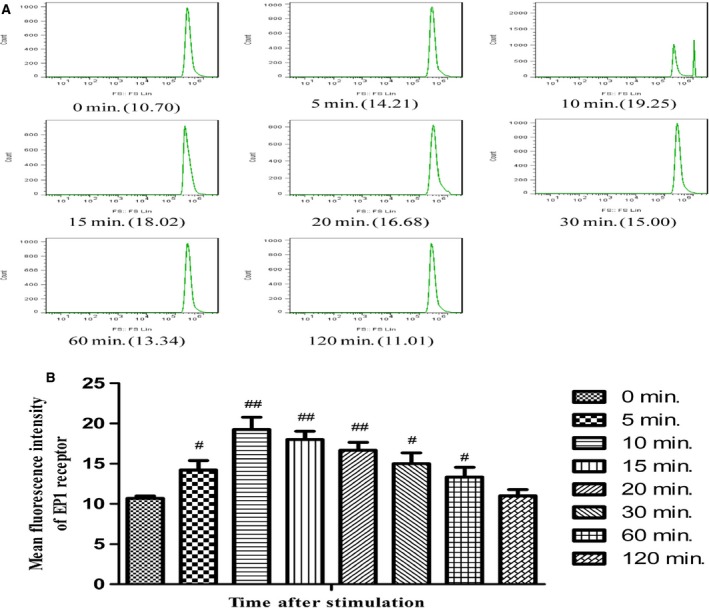
Figure 8.

Membrane expression of the EP1 receptor in GMCs stimulated by PGE 2 at multiple time points. (A) Images of flow cytometry for membrane EP1 expression are shown. (B) Quantification of flow cytometry for EP1 expression in GMCs stimulated by PGE 2 at multiple time points. Data are the mean ± S.D. of at least five experiments. # P < 0.05 and # # P < 0.01 compared with the 0 min. group.
