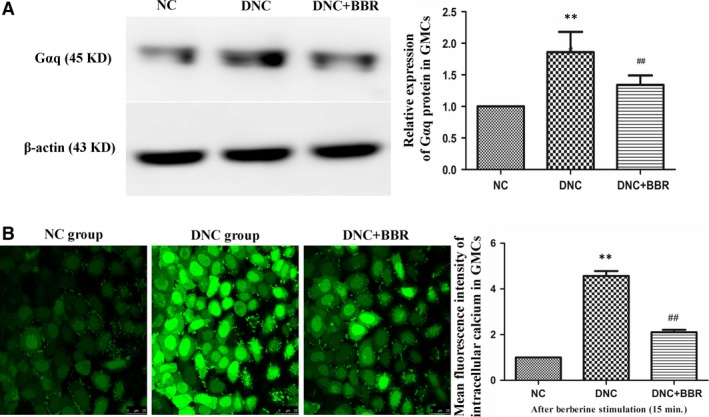
Figure 10.

Effect of berberine on the expression of Gαq and the concentration of [Ca2+]i in GMCs. (A) Cells were treated with or without berberine (60 μM) for 15 min. Gαq expression was detected by western blotting with an anti‐Gαq antibody, and the intensity of each band was normalized to β‐actin. (B) The distribution of [Ca2+]i in GMCs at 15 min. after berberine treatment in the different groups (Scale bar: ×25 μm) and the fluorescence intensity of each group for [Ca2+]i. Experiments were performed at least five times with similar results. **P < 0.01 versus the NC group; # # P < 0.01 compared with the DNC group.
