FIGURE 8.
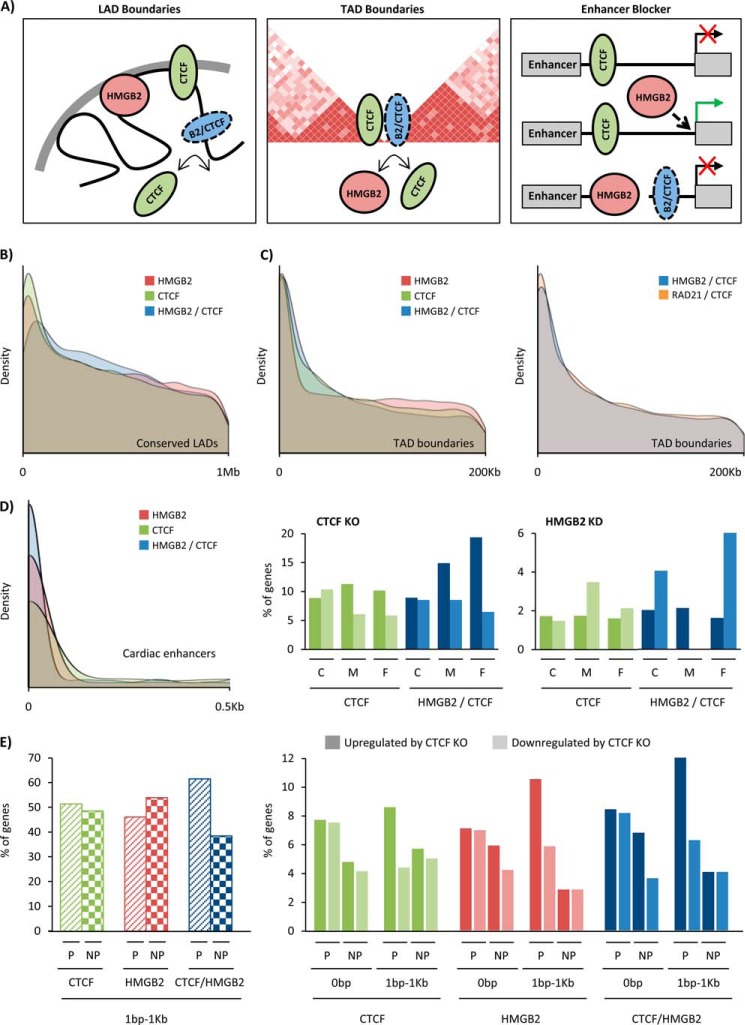
Hmgb2 and Ctcf target shared loci near three-dimensional domain boundaries and cardiac enhancers. A, Ctcf is known to be enriched at LAD and TAD boundaries and to serve as a blocker of enhancer promoter interactions. We show Hmgb2- and Ctcf-shared binding sites are also enriched at TAD boundaries and near cardiac enhancers, with opposing effects on the transcription of genes near these enhancers. B, Hmgb2 peaks that do not overlap Ctcf (Hmgb2-only, red), Ctcf peaks that do not overlap Hmgb2 (Ctcf-only, green), and Hmgb2- and Ctcf-shared peaks (blue) were examined to determine their distance to the nearest conserved mouse lamina-associated domain (LAD, conserved across four mouse cell types). Density plots display the distribution of distances, revealing enrichment of both Ctcf and Hmgb2 at LAD boundaries, with overlapping peaks less enriched (highest peak is further from site of LAD, and peak is shorter and more broad). Signal at 0 bp represents peaks that fall within LADs. C, density plots display the distribution of distances between Hmgb2-only, Ctcf-only, and shared peaks to topologically associating domains (TAD, domain boundaries from mouse cortex but we see similar results with boundaries from mESC). All three sets of peaks are enriched at TAD boundaries (left panel). Cohesin (a complex including Rad21) is known to physically interact with Ctcf at TAD boundaries. Hmgb2- and Ctcf-shared peaks show similar levels of enrichment at TAD boundaries as the levels exhibited by Rad21- and Ctcf-shared peaks (right panel). D, Hmgb2-only and Ctcf-only peaks are enriched near cardiac enhancers (defined by H3K27ac from mouse adult cardiomyocytes), with Hmgb2- and Ctcf-shared peaks enriched to a greater degree (left panel). The nearest genes to cardiac enhancers were found and grouped by the distance of the enhancer to a Ctcf peak (green) or shared peak (blue). Close (C) indicates peaks within 30 bp of enhancer, medium (M) indicates 31–381 bp distance, and far (F) indicates 381 bp to 1 kb. Plotted is the percentage of these nearest genes up- or down-regulated by ctcf KO (middle panel) or hmgb2 KD (left panel) at each distance. When Hmgb2- and Ctcf-shared peaks are within 380 bp to 1 kb of an enhancer, loss of ctcf is three times more likely to cause the nearest gene to be up-regulated than down-regulated, whereas the loss of hmgb2 is four times more likely to cause down-regulation. E, for Ctcf-only, Hmgb2-only, and shared peaks that occur within 1 kb of a gene, but not in a gene, we plotted the percentages that were near active genes (P, presence of RNA pol II peak in promoter) or inactive genes (NP, no pol II). Only the shared peaks showed bias toward being near active genes (left panel). When Hmgb2-only, Ctcf-only, or shared peaks are within 1 kb of an active gene, loss of ctcf is two times more likely to cause up-regulation (dark color) than down-regulation (light color), but no bias is seen for inactive genes or peaks within genes. Rad21 and RNA pol II ChIP-seq represent one biological replication from ENCODE. Location of cardiac enhancers (13), LAD boundaries (59), and TAD boundaries (15) come from published work which cite one, two, and multiple (number not provided) biological replicates, respectively.

