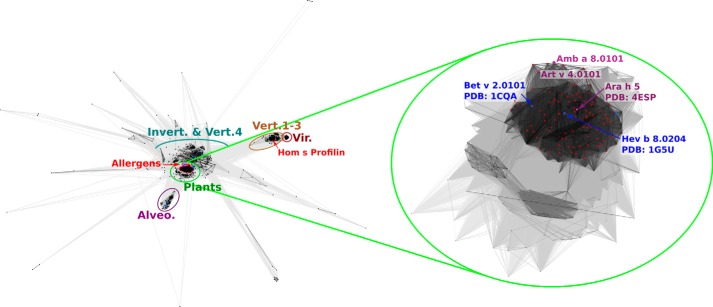
FIGURE 1.
Two-dimensional projection of the CLANS clustering results. Proteins are indicated by dots. Lines indicate sequence similarity detectable with BLAST and are colored by a spectrum of shades of gray according to the BLAST p value. Sequences corresponding to structures in the PDB are indicated by blue dots, and sequences of known allergens are indicated by red dots.

