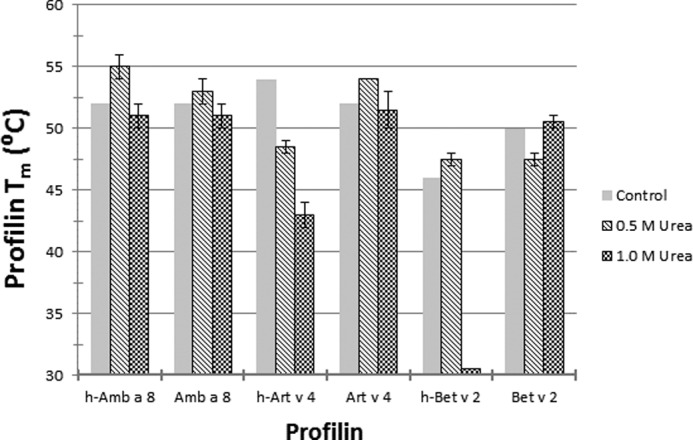
FIGURE 6.

DSF profilin urea screening. Amb a 8, Art v 4, Bet v 2, and their His-tagged counterparts were screened against different concentrations of urea to determine change in protein melting temperature (Tm). The control was profilin stability in gel filtration buffer (10 mm Tris, pH 7.4, 150 mm NaCl). Error bars, S.D.
