FIGURE 9.
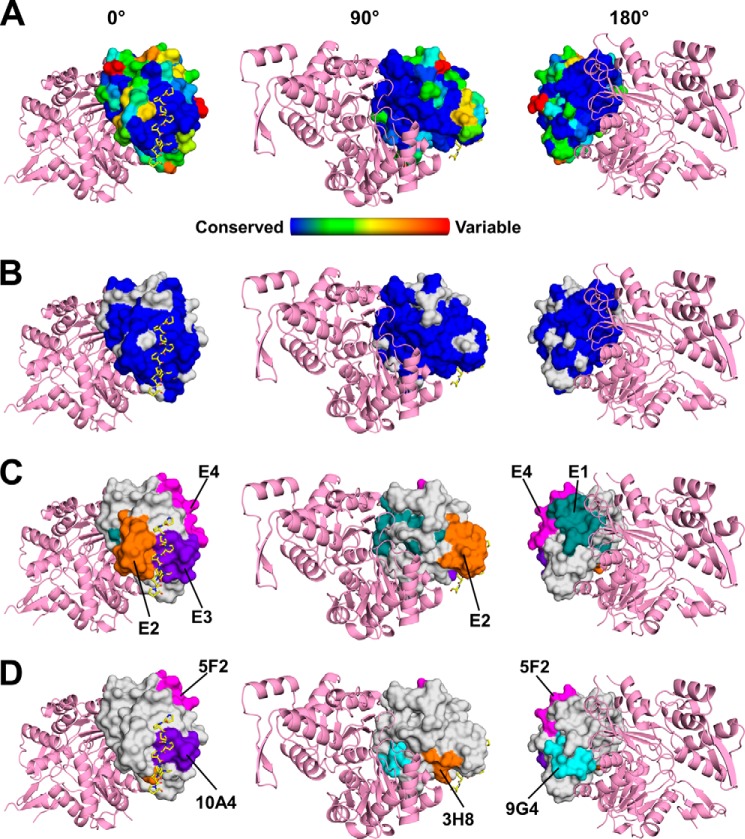
A, sequence conservation of profilins calculated with ConSurf is mapped on the surface of Amb a 8. Actin (pink) was modeled using the structure of human profilin 1 in complex with actin (PDB entry 3CHW). Poly(l-Pro) is shown in a stick representation with carbon atoms marked in yellow. The figure shows three different orientations of the molecules corresponding to 0, 90, and 180° rotation along the y axis. B, residues that are identical in Amb a 8, Art v 4, and Bet v 2 are shown in blue. Residues that are not 100% conserved in these allergens are marked in gray. C, epitopes identified in Cuc m 2. The epitopes are labeled using a convention used in the original paper reporting these epitopes (44, 74). D, epitopes identified in Hel a 2.0101. The epitopes are labeled using a convention used in the original paper reporting these epitopes (43).

