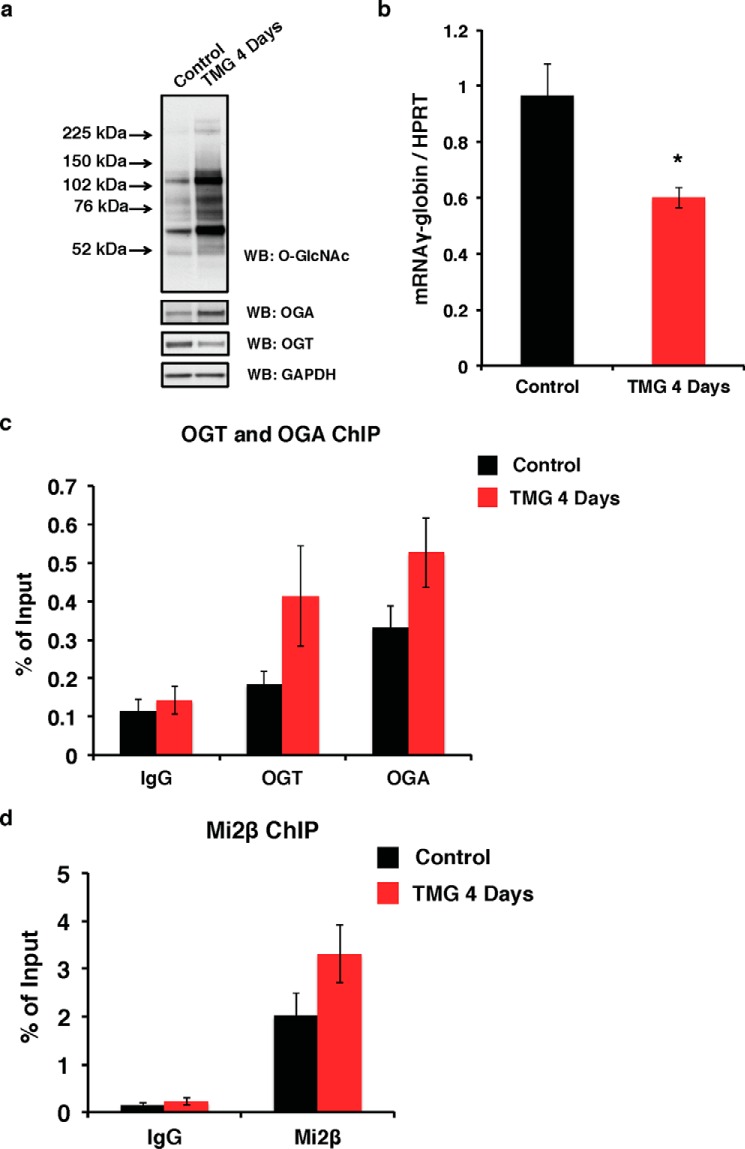
FIGURE 2.
OGT, OGA, and Mi2β increase at the Aγ-globin gene promoter after TMG treatment in WT β-YAC BMCs. a, overall O-GlcNAc levels and OGA and OGT protein expression in total cell lysates from control and 4-day TMG-treated WT β-YAC BMCs cells were analyzed by immunoblotting. GAPDH was used as a loading control. b, γ-globin mRNA level in control and 4-day TMG-treated WT β-YAC BMCs cells was analyzed by qPCR. Mouse HPRT was used as an internal control. OGT/OGA (c) and Mi2β (d) ChIP assays were performed on control and 4-day TMG-treated WT β-YAC BMCs cells, respectively. ChIP DNA was analyzed by qPCR using a set of primers targeting the −566 GATA site of the Aγ-globin promoter. Normal rabbit IgG served as a negative control. All experiments were performed with four biological replicates (* indicates p < 0.05, Student's t test). Error bars represent S.E. WB, Western blotting.

