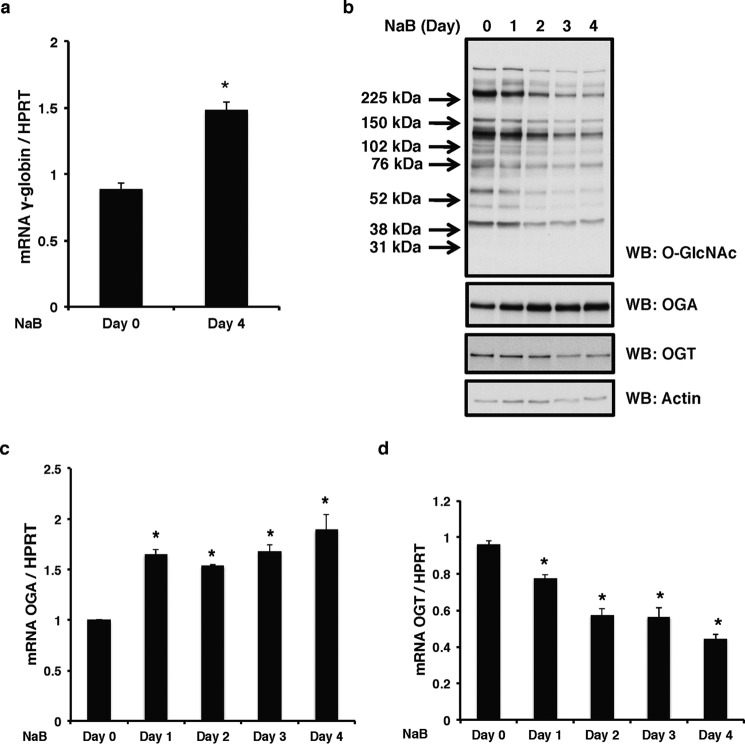
FIGURE 4.
K562 γ-globin expression is increased after NaB induction. K562 cells were treated with NaB for 4 days. Cells were collected daily. a, γ-globin mRNA levels were measured before and after NaB induction by qPCR. b, overall O-GlcNAc levels and OGA and OGT protein expression from total cell lysates were analyzed by immunoblotting. Actin was used as a loading control. OGA (c) and OGT (d) mRNA levels were measured before and after NaB induction by qPCR. Human HPRT was used as an internal control in all qPCR analyses. All experiments were performed with at least three biological replicates (* indicates p < 0.05, Student's t test). Error bars represent S.E. WB, Western blotting.

