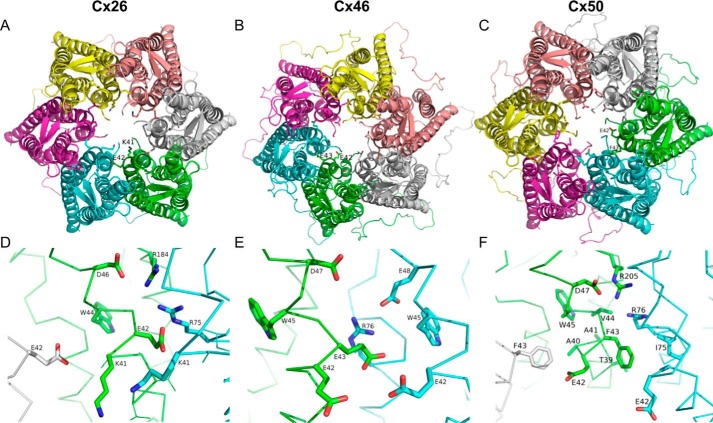
FIGURE 9.
Position and interaction of residues at the end of TM-1. Extracellular view of human Cx26 (A), rat Cx46 (B), and mouse Cx50 (C) in schematic representation with side chains of residues Lys-41 and Glu-42 for Cx26 (A), residues Glu-42 and Glu-43 of Cx46 (B), and residues Glu-42 and Phe-43 of Cx50 (C) represented as sticks. Zooms in the lateral region around residues Lys-41 and Glu-42 in human Cx26 (D), Glu-42 and Glu-43 in rat Cx46 (E), and Glu-42 and Phe-43 in Cx50 (F). Side chain of these residues and possible interacting residues around 5 Å are represented as sticks and labeled. The panels were generated with PyMOL.

