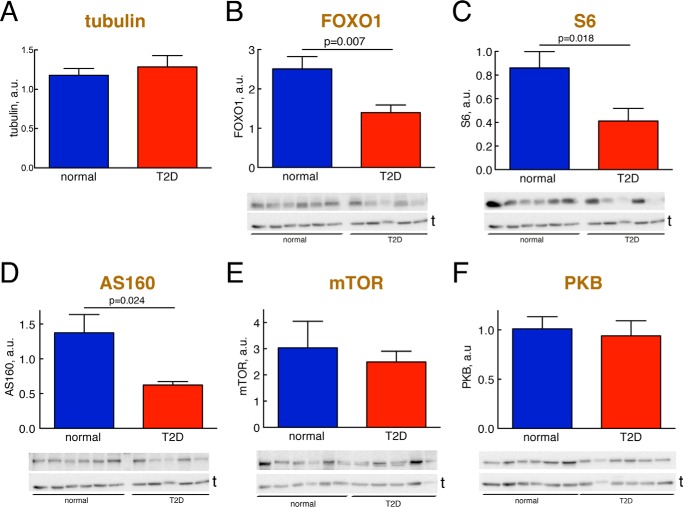
FIGURE 1.
Abundance of signaling proteins, normally and in T2D. Adipocytes from non-diabetic control subjects (blue) or subjects with T2D (red) were analyzed for the abundance of the indicated signaling protein by SDS-PAGE and immunoblotting. Data are presented as mean ± S.E. (error bars) of cell preparations from the indicated number of subjects. a.u., arbitrary units. Representative immunoblots are shown with the lower band representing the loading control tubulin (t). A, tubulin. The amount of tubulin was quantified in the 16 different non-diabetic and 15 different diabetic subjects that were analyzed in B–F. B, FOXO1; 10 non-diabetic control subjects (mean age, 62 years (range, 33–91); mean BMI, 24 kg/m2 (range, 19–27)) and 10 subjects with T2D (mean age, 55 years (range, 28–81); mean BMI, 39 kg/m2 (range, 28–49)). C, S6; nine non-diabetic control subjects (mean age, 64 years (range, 33–91); mean BMI, 24 kg/m2 (range, 19–27)) and eight subjects with T2D (mean age, 55 years (range, 28–81); mean BMI, 39 kg/m2 (range, 28–49)). D, AS160; nine non-diabetic control subjects (mean age, 65 years (range, 43–91); BMI, 20–27 kg/m2; mean BMI, 24 kg/m2 (range, 20–27)) and seven subjects with T2D (mean age, 59 years (range, 28–79); mean BMI, 34 kg/m2 (range, 28–43)). E, mTOR, eight non-diabetic control subjects (mean age, 67 years (range, 37–91); mean BMI, 23 kg/m2 (range, 19–27)) and 11 subjects with T2D (mean age, 64 years (range, 37–91); mean BMI, 37 kg/m2 (range, 28–49)). F, PKB, nine non-diabetic control subjects (mean age, 62 years (age, 33–91); mean BMI, 23 kg/m2 (range, 19–27)) and six subjects with T2D (mean age, 57 years (range, 28–81); mean BMI, 37 kg/m2 (range, 31–45)). The non-diabetic control subjects had a mean fasting plasma concentration of glucose of 6.4 mm (range, 5.3–8.0) and a mean concentration of insulin of 54 pm (range, 6–142).

