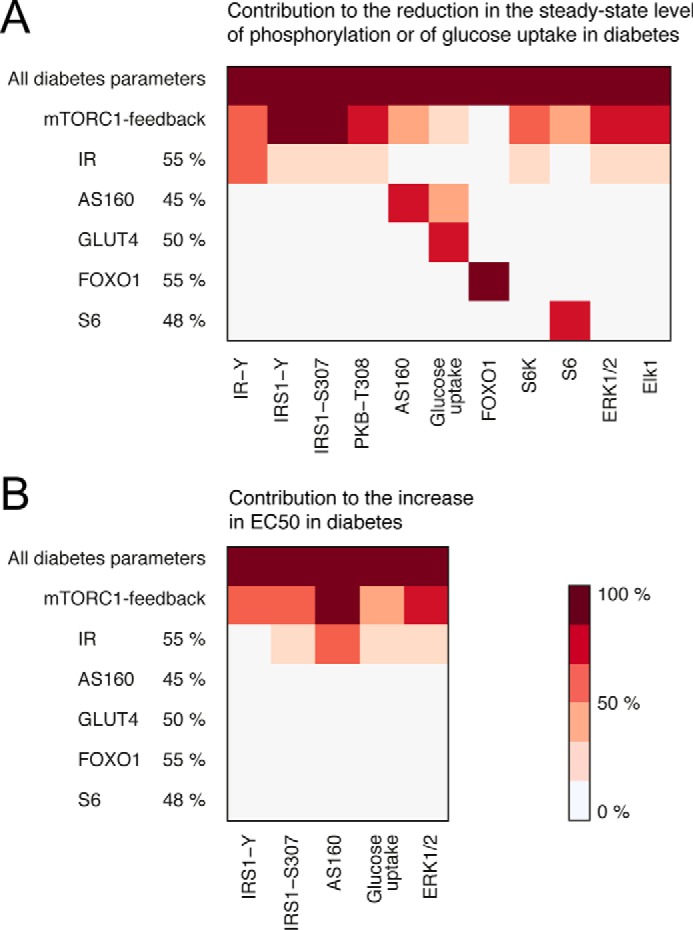
FIGURE 10.

The impact of the individual diabetes parameters. Shown are heat maps of the impact of the individual diabetes parameters on the measured model variables. Light color indicates a small contribution, and dark color indicates a large contribution. The mTORC1 feedback contributes to the reduction in the steady-state level of phosphorylation and to the increased EC50 all over the insulin-signaling network. The reduction of IR levels also has slight effects network-wide, whereas all other diabetes parameters reflect peripheral protein levels, the reductions of which only have local effects. A, the contribution to the reduction in the steady-state level of phosphorylation for the diabetes parameters is calculated as the reduction from normal in the insulin-stimulated steady state for a single diabetes parameter (as indicated) divided by the reduction from normal in the diabetes simulation with all diabetes parameters. B, the contribution to the increase in EC50 for the diabetes parameters is calculated as the increase above normal in EC50 for a single diabetes parameter (as indicated) divided by the increase above normal in the diabetes simulation with all diabetes parameters.
