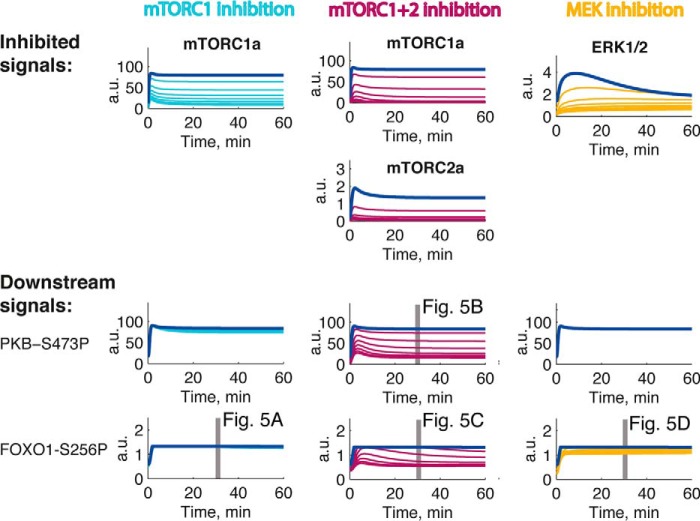
FIGURE 11.
Inhibition of mTORC1, mTORC1+2, or MEK to test the model. Shown are simulations of the mathematical model in Fig. 8 obtained with increasing inhibition (50, 75, 83, 88, 90, 92, and 93%) of mTORC1 (cyan) or mTORC1+2 (violet) or of activation of ERK1/2 (yellow) compared with normal simulations (blue). Shown are the inhibited signals (top) and the downstream effects (bottom). Gray bars indicate the conditions used in the corresponding experimental tests in Fig. 4 as indicated. Data in Fig. 4D were used to estimate model parameters for ERK signaling to phosphorylation of FOXO1; however, the data in Fig. 4, A–C, were not used in estimation of parameters. a.u., arbitrary units. P after a residue number indicates phosphorylation.

