
FIGURE 2.
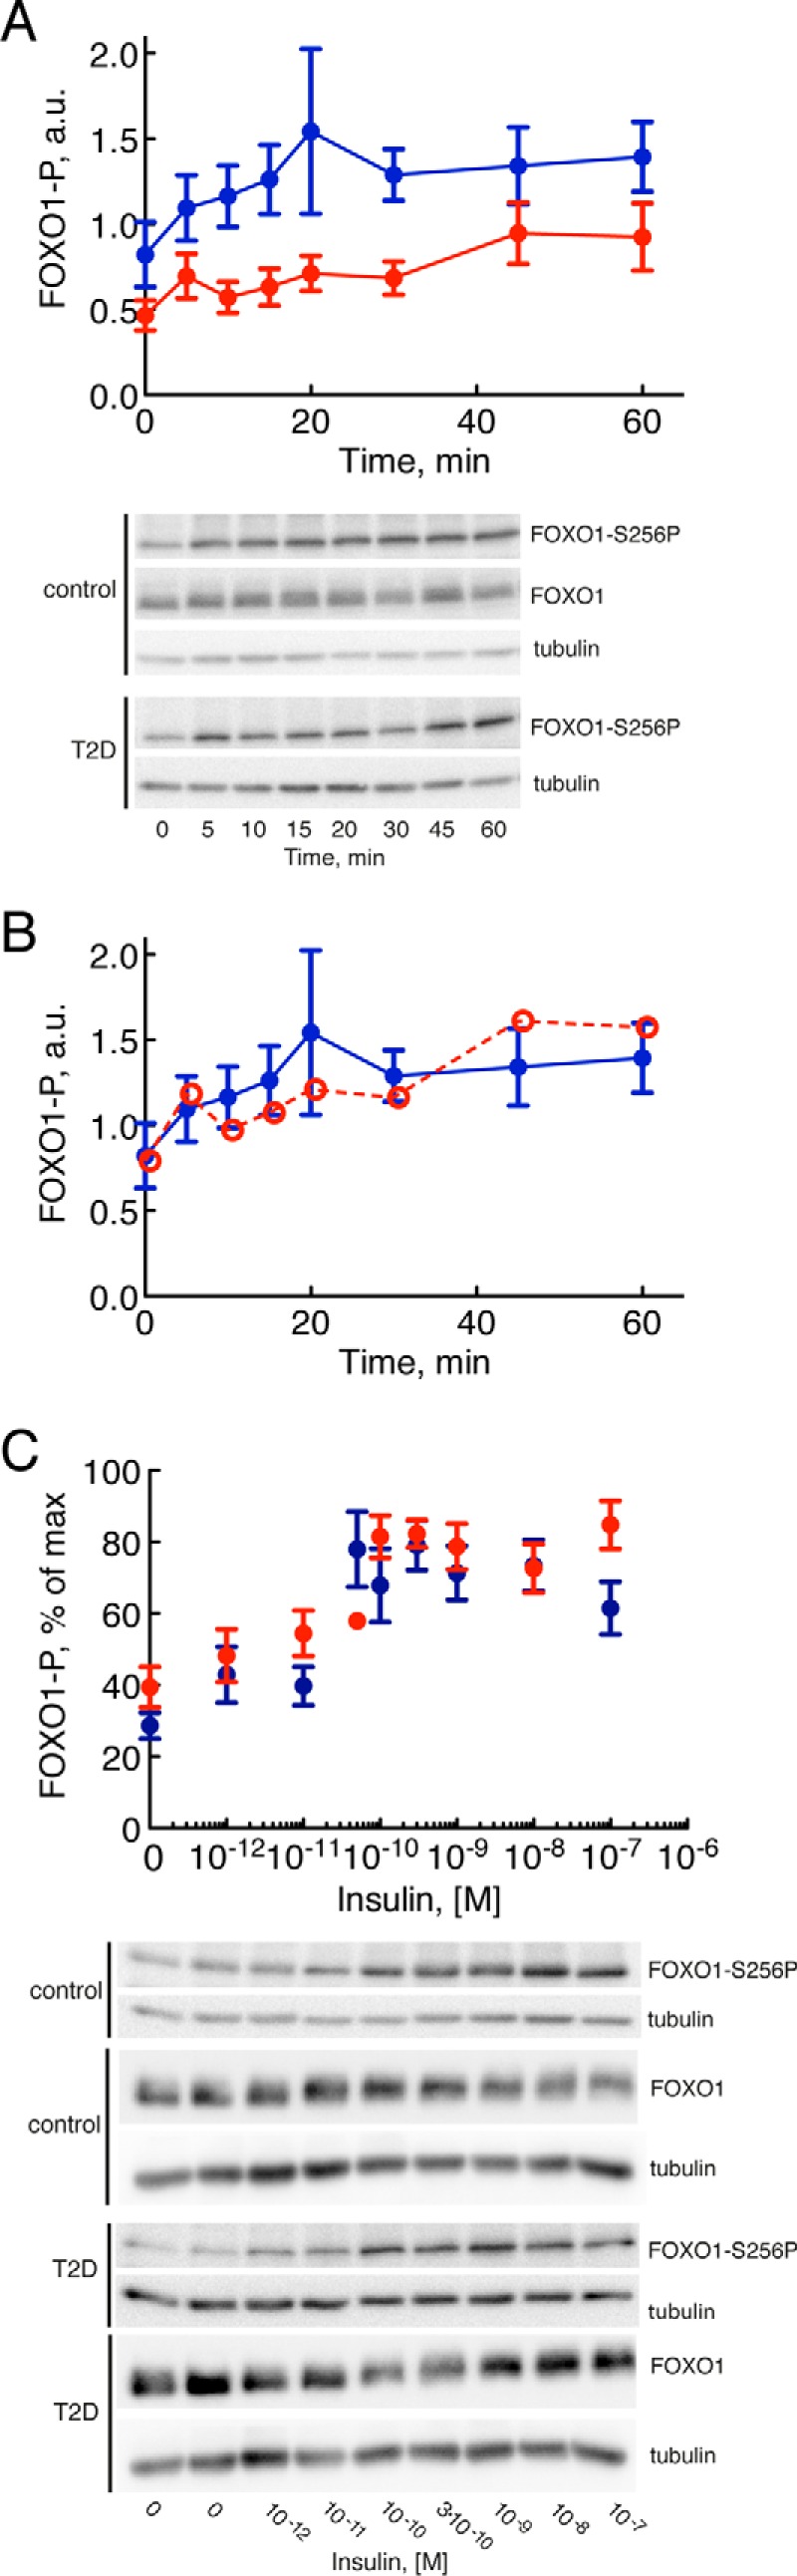
Insulin control of phosphorylation of FOXO1, normally and in T2D. Adipocytes from non-diabetic control subjects (blue) and subjects with T2D (red) were analyzed for phosphorylation, time course and dose response, in response to insulin by SDS-PAGE and immunoblotting. Data are presented as mean ± S.E. (error bars) of cell preparations from the indicated number of subjects. a.u., arbitrary units. Representative immunoblots are shown. A, time course for phosphorylation (P) of FOXO1 at serine 256 in response to 10 nm insulin for the indicated times. Adipocytes from six subjects were analyzed in each group: six non-diabetic control subjects (mean age, 63 years (range, 37–91); mean BMI, 24 kg/m2 (range, 21–27); mean fasting plasma concentration of glucose, 5.8 mm (range, 5.0–8.0); mean concentration of insulin, 53 pm (range, 16–142)) and six subjects with T2D (mean age, 60 years (range, 44–73); mean BMI, 40 kg/m2 (range, 28–52)). B, same as in A, but the extent of phosphorylation in diabetic cells was normalized to the reduced abundance of FOXO1 in diabetic cells (red open and dashed line). C, dose response for phosphorylation of FOXO1 at serine 256 after 30 min in response to the indicated concentrations of insulin. Adipocytes from eight subjects were analyzed in each group except for the 10−10 m concentration of insulin where adipocytes from one diabetic patient were analyzed: eight non-diabetic control subjects (mean age, 65 years (range, 50–85); mean BMI, 26 kg/m2 (range, 23–28); mean fasting plasma concentration of glucose, 6.2 mm (range, 5.0–8.4); mean concentration of insulin, 54 pm (range, 22–97)) and eight subjects with T2D (mean age, 59 years (range, 28–74); mean BMI, 37 kg/m2 (range, 28–52)).