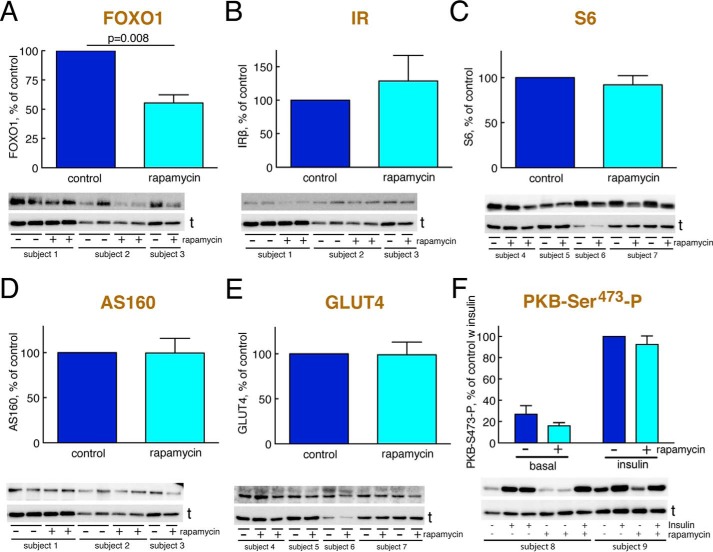
FIGURE 7.
Abundance of signaling proteins after prolonged inhibition of mTORC1 with rapamycin. Adipocytes from non-diabetic control subjects were incubated with 50 nm rapamycin or vehicle (control) for 48 h and then analyzed for the abundance of the indicated signaling protein by SDS-PAGE and immunoblotting. Data are presented as mean ± S.E. (error bars) of cell preparations from the indicated number of subjects. a.u., arbitrary units. Representative immunoblots are shown with the lower band representing the loading control tubulin (t). Subjects are arbitrarily numbered for this figure. A, abundance of FOXO1 (four subjects). B, abundance of IR (four subjects). C, abundance of S6 (four subjects). D, abundance of AS160 (four subjects). E, abundance of GLUT4 (five subjects). F, phosphorylation (P) of PKB at Ser473 (four subjects).

