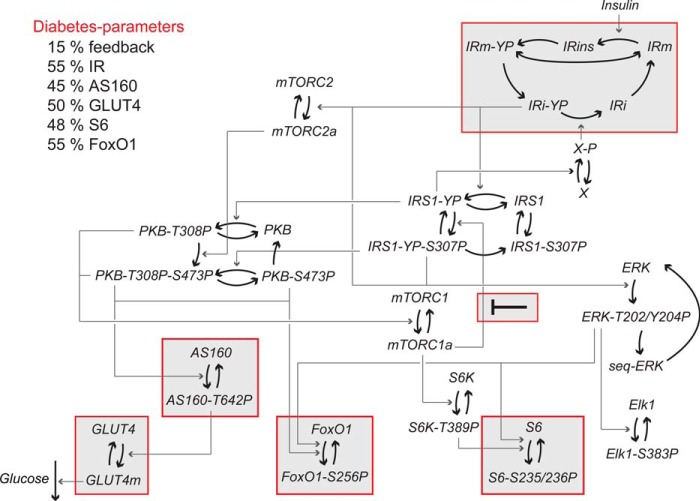
FIGURE 8.
A comprehensive mathematical model for insulin resistance in T2D. Given is the structure of the complete mathematical model for insulin signaling and insulin resistance in human adipocytes with the new FOXO1 module included. The insulin receptor (IR) exists in five states in the model: phosphorylated in the membrane (IRm-YP) and internalized (IRi-YP), insulin-bound (IRins), and inactive in the membrane (IRm) and internalized (IRi). To simulate the model in the diabetic state, the diabetes parameters (shown in “red”) were used. The main diabetes parameter (15% feedback) is fitted to data. All other diabetes parameters are based on measurements of protein levels herein (Fig. 1, B–D), 55% IR (31), and 50% GLUT4 (25). Heavy arrows represent transitions between states of the same protein, and arrows represent activation/deactivation of proteins. Model equations are described in detail in the supplemental material. P after a residue number indicates phosphorylation.

