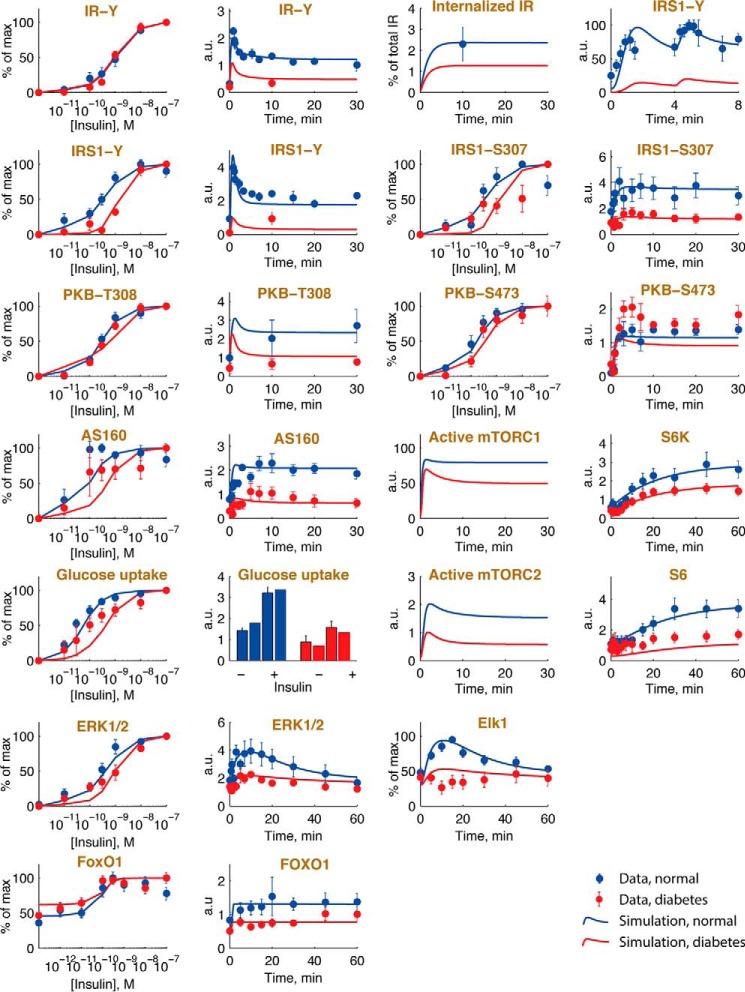
FIGURE 9.
Model simulations are in agreement with normal and diabetes data. Shown are model simulations (lines) using the mathematical model in Fig. 8 for insulin signaling, normally (blue) and in T2D (red), and comparisons with the corresponding experimental data (dots and error bars (S.E.)) for the indicated signaling intermediaries. Normal simulations are scaled with normalization constants to the experimental data (blue). The T2D simulations are obtained by changing the diabetes parameters as shown in Fig. 8. The data obtained herein for FOXO1 are explained in the legend to Fig. 2, and the other data sets are detailed in Refs. 25, 26, and 52. a.u., arbitrary units.

