
FIGURE 6.
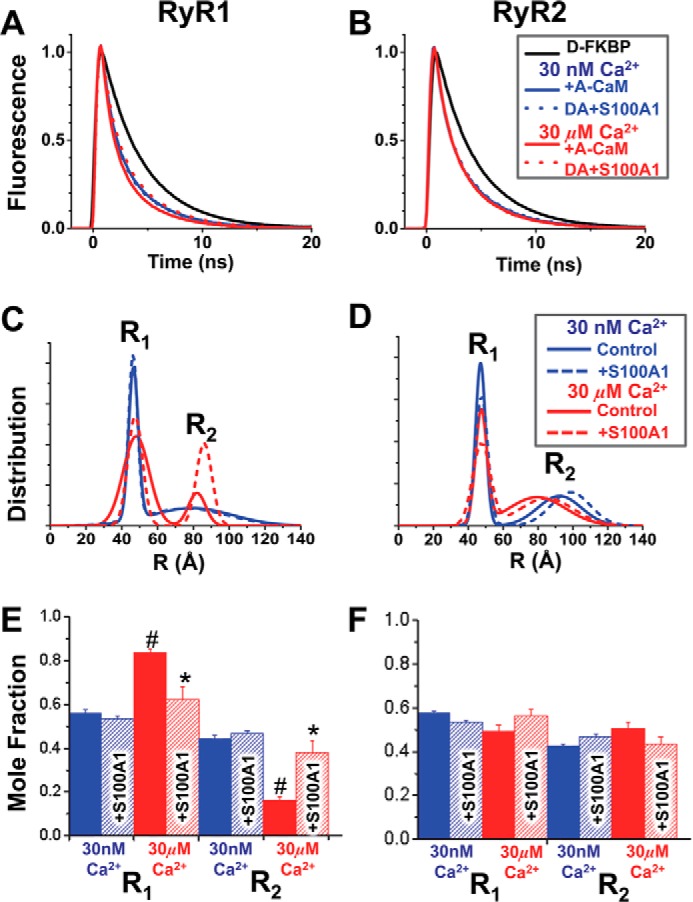
TR-FRET detection of S100A1 structural effect on the CaM·RyR complex. SR membranes from skeletal (A, C, and E) or cardiac (B, D, and F) muscle were labeled with D-FKBP, preincubated with 200 μm S100A1, and then incubated with 800 nm CaM labeled with acceptor probe at the N-lobe residue via T34C (AN-CaM). A and B, fluorescence decays of D-FKBP with AN-CaM in low (blue) and high Ca2+ (red), with (dotted lines) and without (solid lines) S100A1. C and D, multiexponential analysis of the TR-FRET data yielded a two-distance (R1 and R2) Gaussian distribution model of the separation between D-FKBP and AN-CaM within RyR. E and F, molar fractions of the populations associated with each of the two structural states characterized by distances R1 and R2. The S100A1 effects are shown in hatched bars. *, significantly different from the no-S100A1 control. #, significantly different from 30 nm Ca2+, p < 0.05, as determined by analysis of variance with Fisher's post hoc test.