
Figure 3. Quantifications of HMP data among groups.
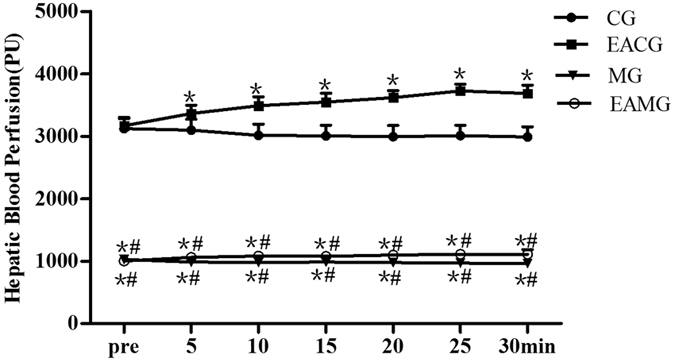
HMP time plotted against perfusion amount. *P < 0.05, vs CG. #P < 0.05, vs EACG (one-way ANOVA with LSD’s two groups comparison test). Data are mean ± SD.
Official websites use .gov
A
.gov website belongs to an official
government organization in the United States.
Secure .gov websites use HTTPS
A lock (
) or https:// means you've safely
connected to the .gov website. Share sensitive
information only on official, secure websites.
HMP time plotted against perfusion amount. *P < 0.05, vs CG. #P < 0.05, vs EACG (one-way ANOVA with LSD’s two groups comparison test). Data are mean ± SD.