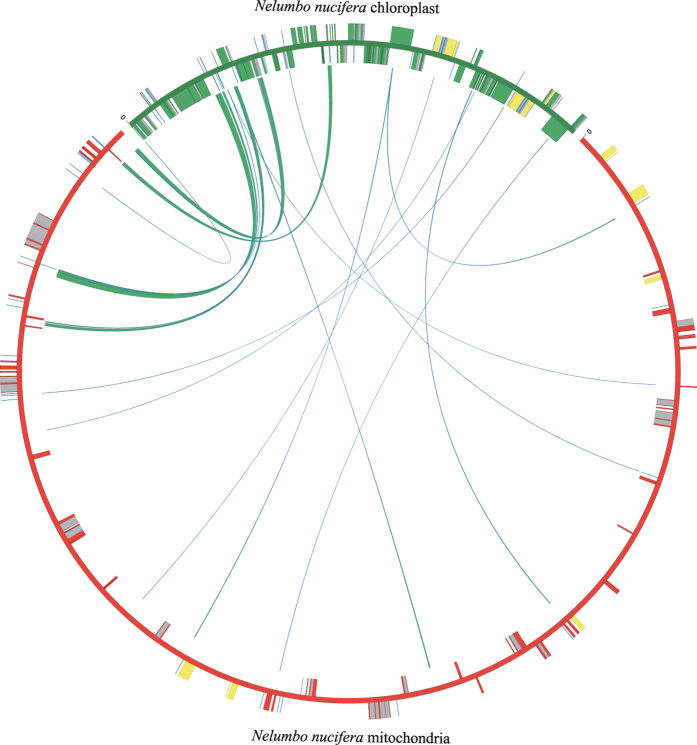
Figure 2. Schematic representation of chloroplast DNA transferred into the Nelumbo nucifera mitochondrial genome.
The green line within the circle shows the regions of the plastid genome that has been inserted into different locations of the mitochondrial genome. The genes in plastid and mitochondria are indicated by green and red boxes, respectively. The introns are indicated by grey boxes, and rRNAs and tRNAs are indicated by yellow and blue boxes, respectively. The boxes on the inside and outside of the maps were transcribed in clockwise and counterclockwise directions, respectively.

