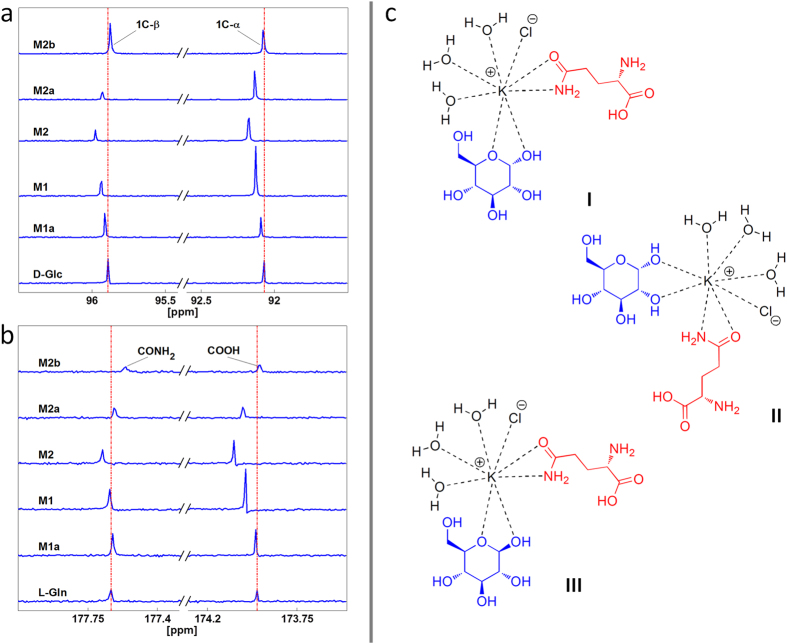
Figure 1. Detailed 13C NMR spectra of osmolyte mixtures and proposed supramolecular complexes.
(a) Modification of the D-Glc chemical shift and intensity from that of the pure natural molecule in M1a, M1, M2, M2a, and M2b. Dashed vertical lines indicate the natural molecule peak as a reference. (b) Modification of the L-Gln chemical shift and intensity from that of the pure natural molecule in M1a, M1, M2, M2a, and M2b. Dashed vertical lines indicate the natural molecule peak as a reference. (Both for D-Glc and L-Gln, only the relevant spectral region is shown, for clarity, and the data are presented in a stacked plot with scaled intensity to show the modifications of the chemical shifts.) (c). Proposed osmolyte complexes.

