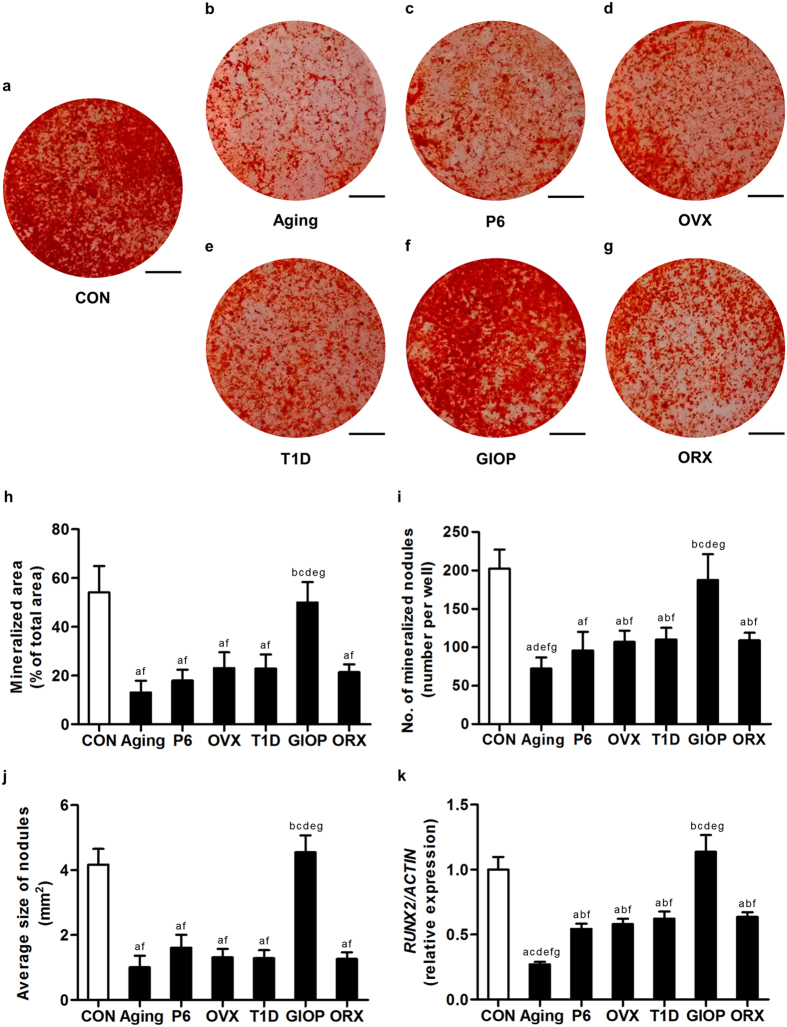
Figure 6. Osteogenic differentiation of bone marrow stromal cells (BMSCs).
(a–g) Representative alizarin red staining images demonstrating mineralization by murine BMSCs derived from the control groups (a) and osteoporoses induced by natural aging (b), accelerated senescence (SAMP6) (c), ovariectomy (OVX) (d), type 1 diabetes (T1D) (e), excessive glucocorticoids (GIOP) (f), and orchidectomy (ORX) (g). Mice were sacrificed after 4 weeks of modeling. 1st-passaged BMSCs were seeded at 2 × 10⁵ cells/well in 12-well plates and underwent osteogenic induction for 14 days. Bars: 5 mm. (h–j) The corresponding parameters of mineralized area over total area (h), number of mineralized nodules per well (i) and average size of nodules (j) showing decreased mineralization of BMSCs in osteoporoses except in GIOP. BMSCs from natural aging mice developed the least number of mineralized nodules. (k) After 14-day osteogenic induction, quantitative real-time polymerase chain reaction (qRT-PCR) analysis of the mRNA expression level of osteogenic marker gene Runt-related transcription factor 2 (RUNX2). The corresponding values showed inhibited osteogenic differentiation of BMSCs in osteoporoses except in GIOP. BMSCs from the natural aging mice expressed the lowest level of RUNX2. The expression of RUNX2 was normalized to that of ACTIN. Data represents mean ± standard deviation (SD). n = 6 per group. aP < 0.05 with the control groups; bP < 0.05 with the natural aging group; cP < 0.05 with the SAMP6 group; dP < 0.05 with the OVX group; eP < 0.05 with the T1D group; fP < 0.05 with the GIOP group; gP < 0.05 with the ORX group.

