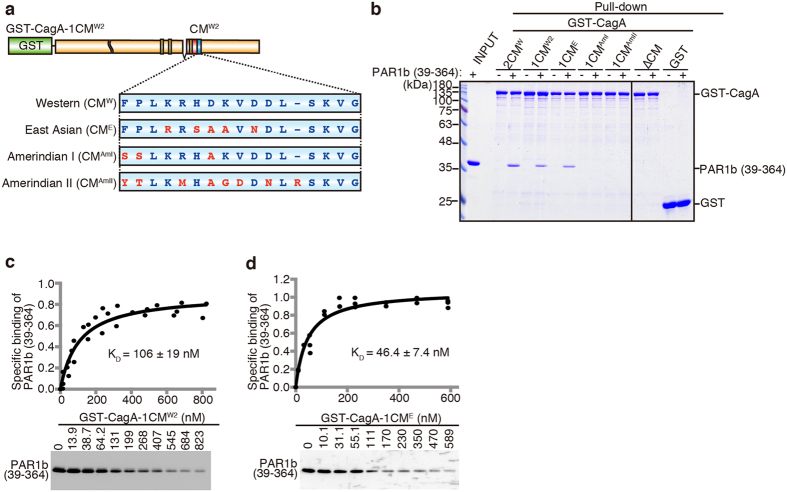
Figure 4. Binding affinities of regional CagA CM variations to PAR1b.
(a) Schematic diagram of GST-CagA-1CMW2 carrying various regional CM motifs at the CMW2 position. (b) GST pull-down between various GST-CagA-1CMX constructs with various CM motifs and PAR1b (39–364). (c,d) Saturation binding curves obtained by the quantitative GST binding assay between PAR1b (39–364) and GST-CagA-1CMW2 (c) or GST-CagA-1CME (d). Values are dissociation constants (KD) ± SE, n = 3. Full-length gels and blots are presented in Supplementary Fig. S3.

