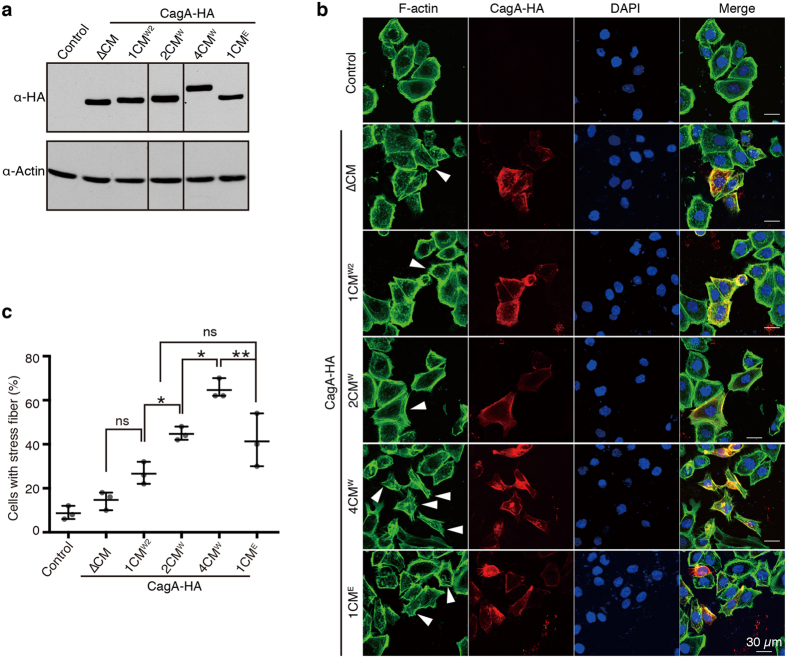
Figure 5. CM-dependent augmentation of stress fiber formation by CagA.
(a) Immunoblots of AGS total cell lysates 24 h after transfection with the various pCDH-EF1-CagA-HA expression vectors as indicated. CagA-HA was detected by using anti-HA (3F10) as primary antibody. Control indicates cells transfected with the empty pCDH-EF1 vector. Full-length blot is presented in Supplementary Fig. S4. (b) Representative fluorescent images of AGS cells after transfection. F-actin was visualized by Alexa Fluor 488 phalloidin. CagA-HA was detected using anti-HA (C29F4) followed by Alexa Fluor 546 anti-rabbit antibodies. Nuclei were stained with DAPI. Arrowheads mark CagA-HA expressing cells positive for stress fiber. (c) Quantification of CagA-HA expressing AGS cells displaying stress fiber. 50 CagA-positive cells per construct were analysed for stress fiber formation per experiment. For control cells, 50% of cells in each image were chosen randomly and assessed for stress fiber formation. Error bars represent mean ± range, n = 3. *P < 0.05, **P < 0.01, repeated measures one-way ANOVA, post-hoc Tukey’s test.

