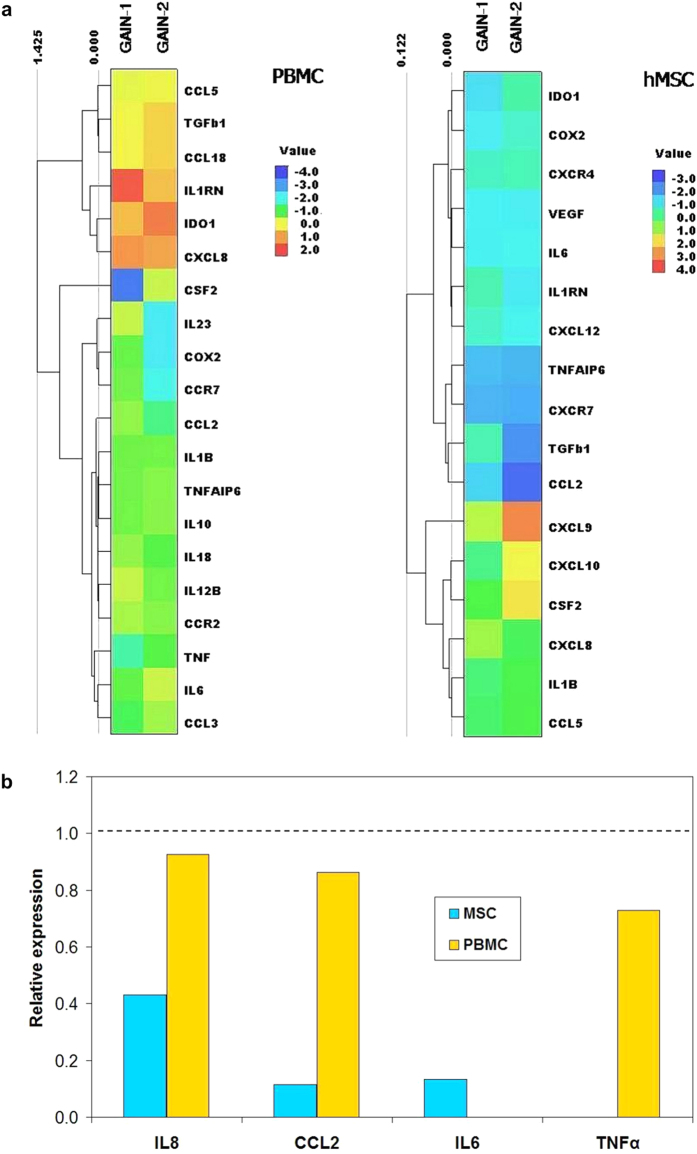
Figure 4. The immunologic profile impact on GAIN scaffolds for hMSCs and PBMCs (incubated for 24 h) with the inflammatory signature compared to the cells without the scaffold (control).
(a) mRNA expression of genes responsible for immune reaction (quantitative real-time polymerase chain reaction, RT-qPCR). The results are represented as a heat map for two independent set of measurements on separate GAIN scaffolds, revealing simultaneously row hierarchical cluster structure in a data matrix with the location of the respective tiles near each other telling about similarity in the respective gene expression groups. (b) Secretion of some important cytokines (enzyme-linked immunosorbent assay, ELISA), normalized to the control cells expression and displayed as a histogram, where dashed line corresponds to the expression level of cytokines in the control cells.

