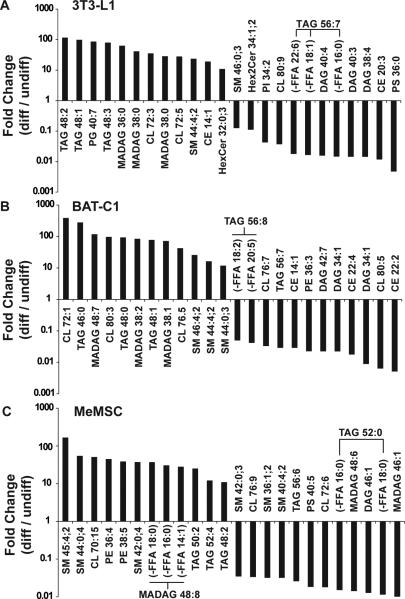
Figure 3. Characterization of lipids in cell models of adipogenic differentiation.
3T3-L1 (A), BAT-C1 (B), and MeMSC (C) were analyzed before and after induction of differentiation.Shown are lipid species that were significantly different (P <0.05) and showing greater than 10-fold change. Fold changes represent the levels of lipids between differentiated (diff) versus undifferentiated (undiff) cells.

