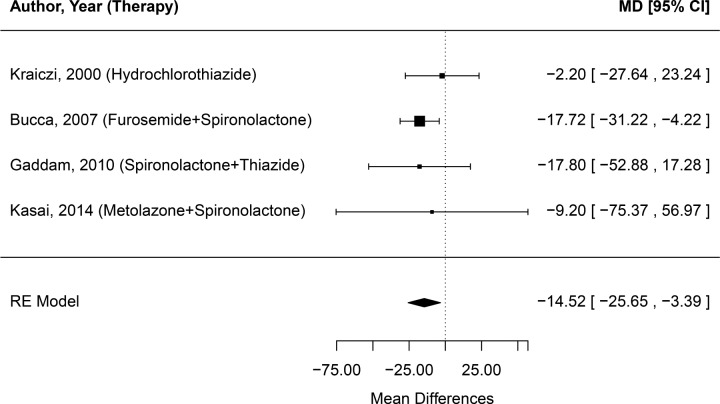
Figure 3. Forest plot of effect of diuretic treatment on change in severity of obstructive sleep apnea (mean change in apneahypopnea index).
The effect size estimate is given for each study expressed in terms of mean differences (MD), with the corresponding 95% confidence internal (CI) indicated by the error bars. The pooled estimate is shown according to the random- effects (RE) model.

