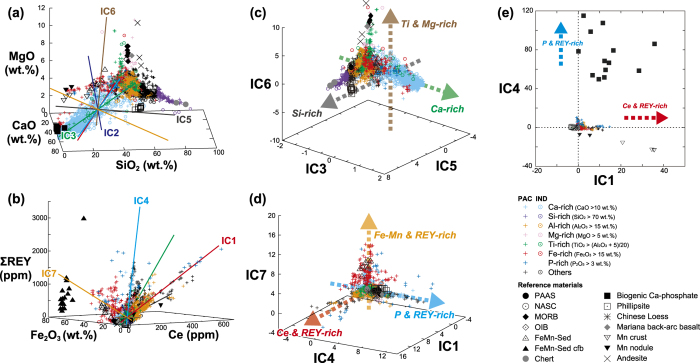
Figure 2. Compositional data of deep-sea sediments and extracted geochemical independent components (ICs).
The ICs are projected in representative compositional subspaces of (a) SiO2–CaO–MgO and (b) Fe2O3–Ce–ΣREY (except Ce) as vectors showing specific directions along which the original chemical compositions changed. The label of each IC is placed along its positive axis. (c–e) show the data projected into IC subspaces. Dotted arrows indicate characteristic compositional changes along each IC axis. Sediment samples with specific compositions are colour coded as shown in the legend. No P-rich (P2O5 > 3 wt.%) sample was found in the Indian Ocean in the present work. Reference materials were not included in the dataset analysed by Independent Component Analysis (ICA) but were projected into IC spaces by using the same linear transformation as that for the sediment data, as shown in Supplementary Fig. S4. The data sources of the reference materials are compiled in Supplementary Fig. S2.

