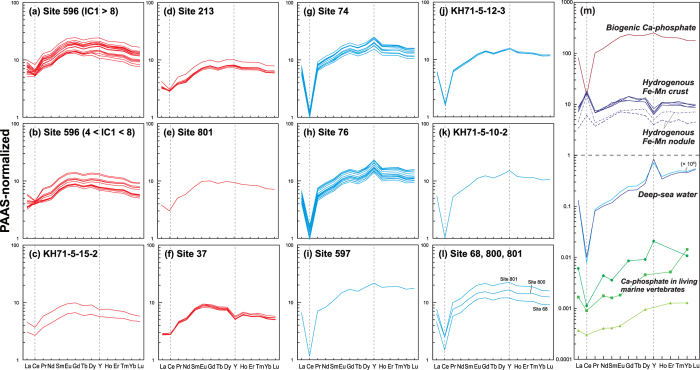
Figure 4. Average shale-normalised REY patterns of representative samples.
PAAS38 was employed as the average shale. (a–f) correspond to high-IC1 samples, and (g–l) are high-IC4 samples. The REY patterns of biogenic Ca-phosphate in REY-rich mud25 and those in living marine vertebrates23,39, hydrogenous Fe–Mn oxides33,60, and deep-sea water in the western South Pacific Ocean57 and northeastern Indian Ocean58 are shown in (m) for comparison.

