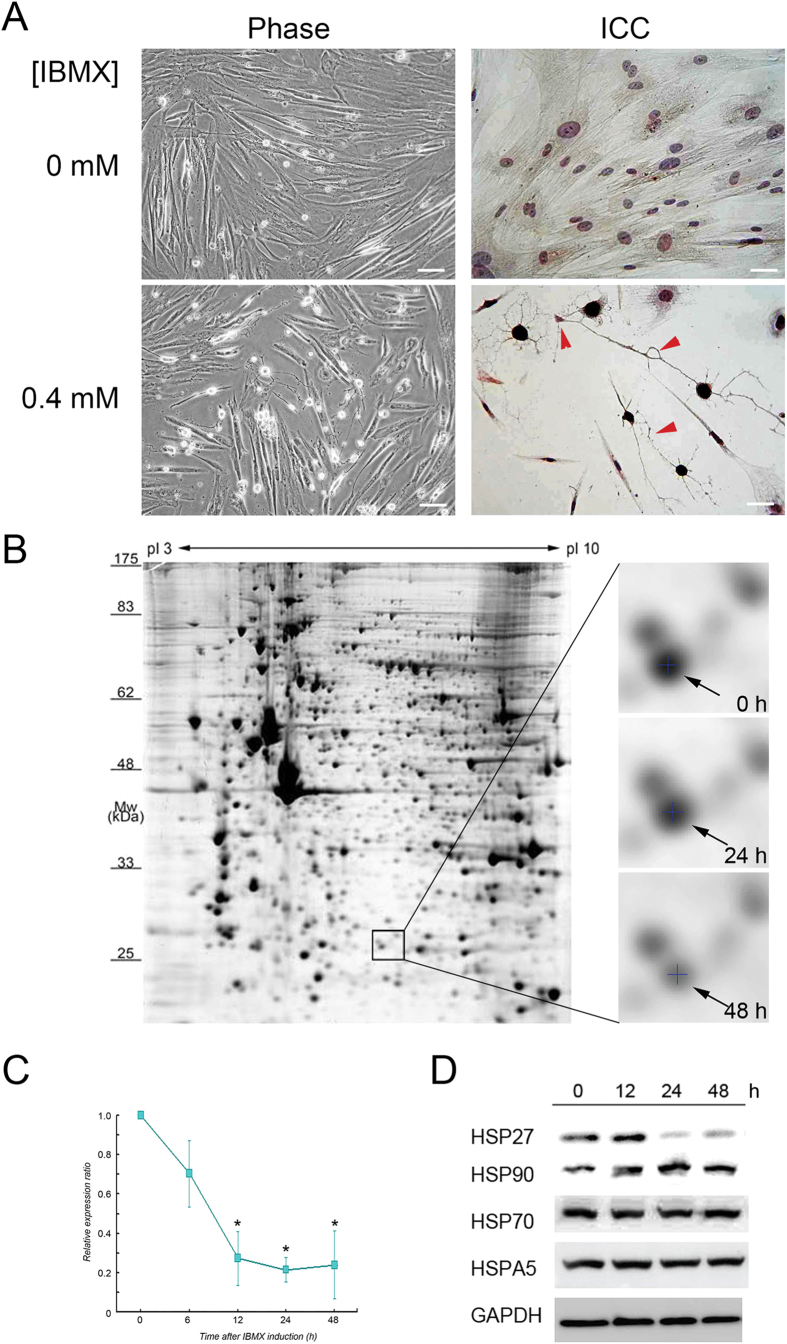
Figure 1. Cell model and expression profiles of HSP27 in neurons differentiated from PDMCs.
(A) Cell morphology showing the differentiation of neurons derived from PDMCs. Phase contrast images of PDMCs (left upper panel) and neuron-like cells induced by IBMX (left lower panel). Immunocytochemistry analysis of PDMCs (right upper panel) and differentiated neuron-like cells using anti-NSE antibody (right lower panel). Induced neurons extended neurites and formed synaptic connections with each other (red arrowheads). Scale bar = 100 μm. (B) Temporal expression of HSP27 protein in the study model was profiled using 2D-PAGE. PDMCs were harvested at the indicated time points after treatment with IBMX. The proteins at each time point were profiled using 2-DE-PAGE. Cell extracts (300 μg) from each time point were separately subjected to the 2-DE procedure, and protein spots were visualized with silver staining. The rectangle represents the location of HSP27 in 2D-PAGE images. The HSP27 expression level in each 2-DE-PAGE was selected, marked by a cross and indicated with arrows, showing that the protein expression of HSP27 at different time points decreased after IBMX induction (right panel). (C) qPCR analysis of mRNA expression in the PDMCs after IBMX induction. Each time point was evaluated in five independent experiments. The star indicates statistical significance with p value < 0.05. (D) Immunoblots for HSP27, HSP90, HSP70 and HSPA5 after IBMX induction of PDMCs. Cell extracts (30 μg) were prepared from induced PDMCs at the indicated time points (0, 12, 24 and 48 h). GAPDH was used as an internal control.

