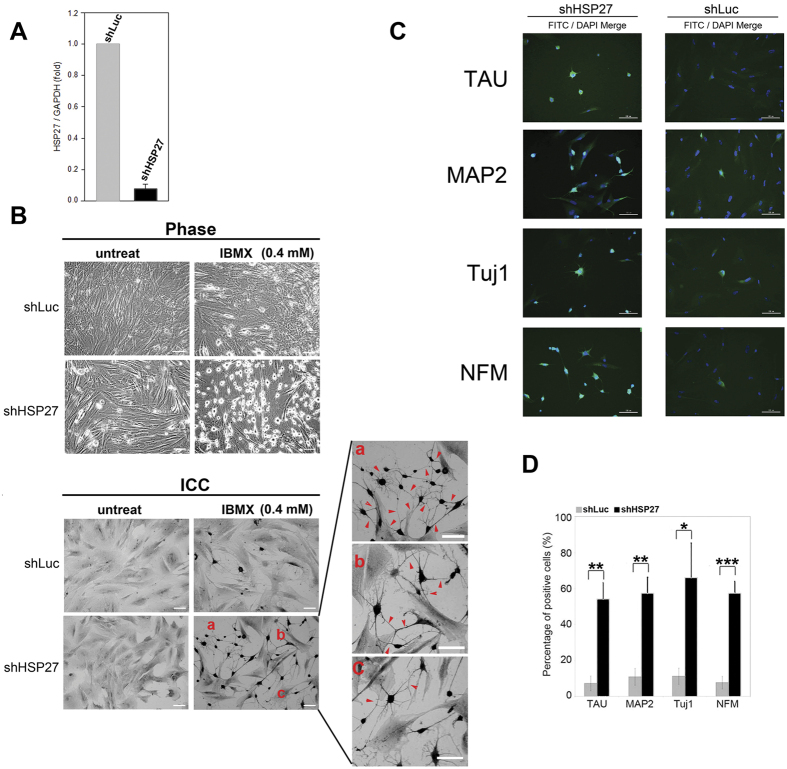
Figure 4. Characterization of neurons induced from HSP27-silenced PDMCs.
PDMCs were infected with lentiviruses containing shRNAs targeting HSP27 (shHSP27) or luciferase (shLuc). After eighteen days of puromycin selection, the HSP27 mRNA expression levels were quantified by qRT-PCR (A). HSP27-silenced PDMCs exhibited 90% downregulation of HSP27 expression. The results were determined in three independent experiments. The HSP27-silenced and Luc-silenced PDMCs were treated with 0.4 mM IBMX. After 6 h, the cells were imaged using an inverted phase microscope (B, upper panel, Phase). The cells were also subjected to immunocytochemical staining for MAP2, a neuron-specific cytoskeletal protein (B, lower panel, ICC). The HSP27-silenced PDMCs and Luc-silenced PDMCs showed almost identical cell morphology before induction. However, after induction, the HSP27-silenced PDMCs showed numerous differentiated neurons compared to the Luc-silenced cells. Additionally, there were many synaptic connections, some of which had begun to form a network, among the HSP27-silenced PDMCs, as indicated by red arrowheads. The relative positions of the enlarged rectangles are indicated by a, b and c in the original image. (Scale bar = 100 μm). (C) The HSP27-silenced or Luc-silenced cells were induced with 0.4 mM IBMX and fixed for immunostaining. The cells were stained with primary antibodies against several neuronal markers including Tau, MAP2, Tuj1 and NFM, followed by appropriate FITC-conjugated secondary antibodies. The cell nuclei were counterstained with 4′,6-diamino-2-phenylindole (DAPI). The FITC and DAPI images for each condition were merged. (Scale bar = 100 μm). (D) The bar chart shows the percentage of FITC-positive cells among the DAPI-positive cells quantified from the above conditions. *p < 0.05; **p < 0.01; ***p < 0.001.

