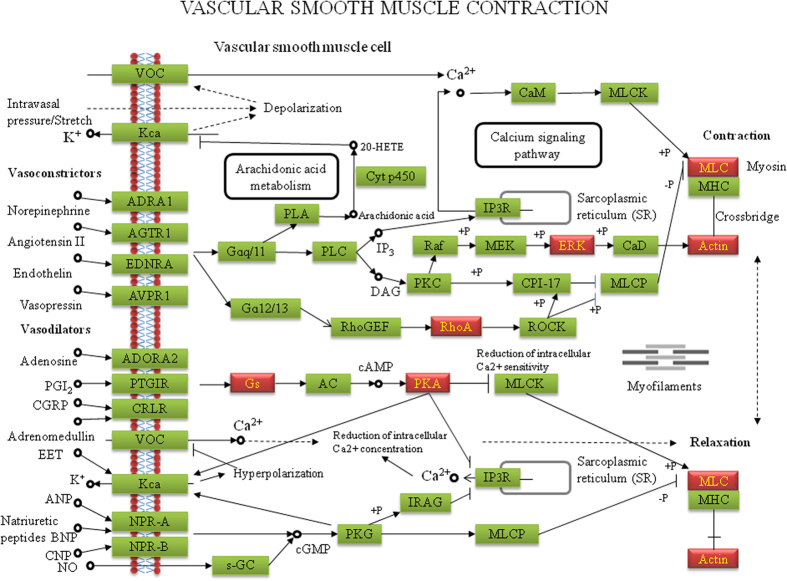
Figure 6. Differentially expressed proteins visualized in the pathway of Vascular smooth muscle contraction.
Green labeled boxes represent the annotated proteins in the pathway of Vascular smooth muscle contraction. Highlighted red boxes indicate the differentially expressed proteins by the expression of MRJP1 in VSMCs that are enriched in the pathway. The proteins are visualized by online software KEGG Mapper (http://www.genome.jp/kegg/tool/map_pathway2.html) and the layout of the pathway is modified from that of Kanehisa Laboratories.

