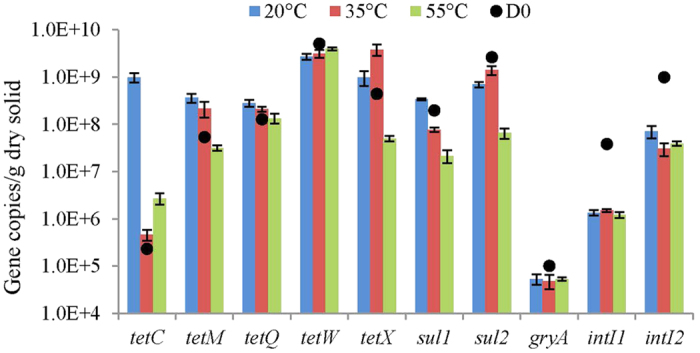
Figure 1. Absolute abundance of the ARGs and integrase genes detected at the start and end of anaerobic digestion.

Black solid circles represent the absolute abundance of gene copies at the start of digestion. Values represent the means based on three replicates. Bars represent standard errors.
