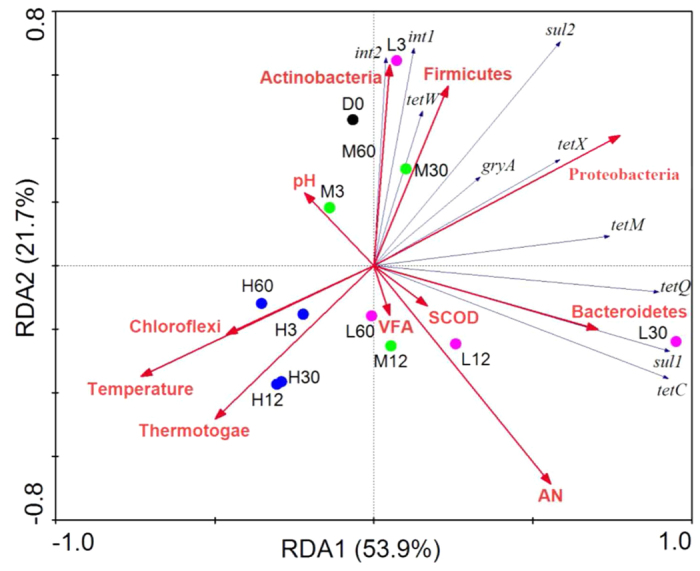
Figure 5. Redundancy analysis to assess the relationships among environmental factors (red arrows), main bacterial phyla (red arrows), and ARGs (blue arrows).

L represents moderate treatment (20 °C), M represents mesophilic treatment (35 °C), and H represents thermophilic treatment (55 °C). AN: available nitrogen; VFA: volatile fatty acids; SCOD: soluble chemical oxygen demand.
