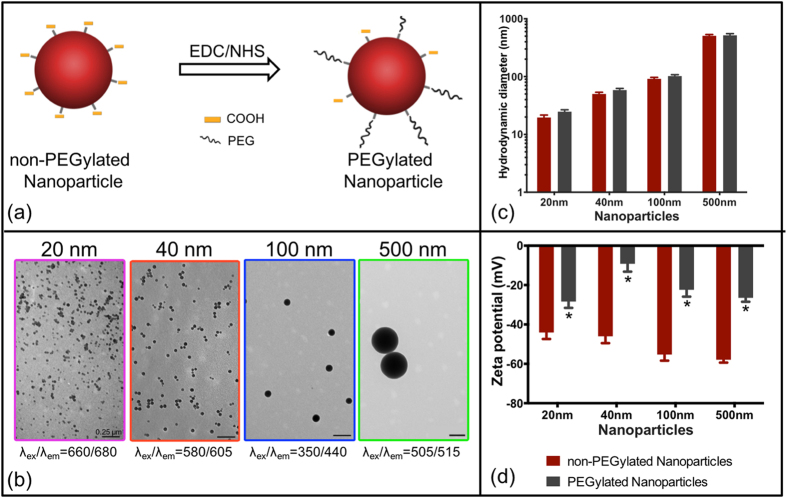
Figure 1.
Nanoparticle characterization (a) Schematic of nanoparticle PEG conjugation using EDC/NHS chemistry. (b) TEM images of monodispersed nanoparticles (PEGylated). (c) Hydrodynamic diameter of non-PEGylated and PEGylated nanoparticles. (d) Zeta potential of non-PEGylated and PEGylated nanoparticles, *p < 0.05, t-test. Error bars represent standard error of mean with n = 3 per group.

