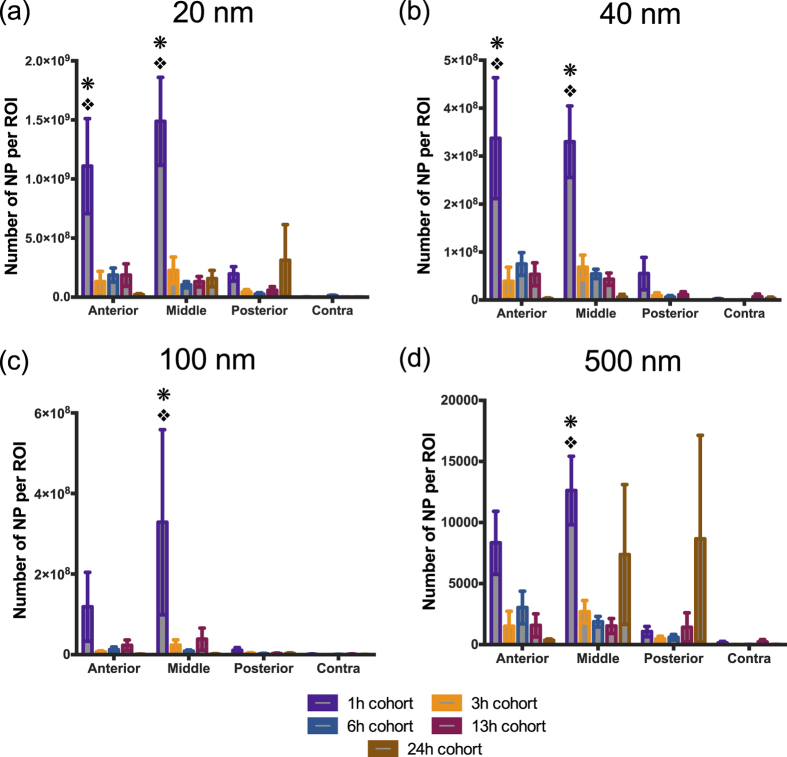
Figure 6. Spatial distribution of nanoparticle accumulation.
Quantitative analysis of (a) 20 nm, (b) 40 nm, (c) 100 nm, (d) 500 nm nanoparticles at different anatomical regions and different time points. *p < 0.05 compared to contralateral ROI (contra), p < 0.05 compared to posterior ROI (posterior); Tukey’s post-hoc test. Error bars represents standard error of mean with n = 4 per group.

