
Figure 4.
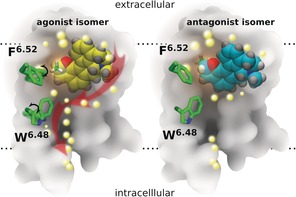
Schematic representation of ligand interactions and water influx in the binding site of the 5‐HT1A receptor (transmembrane cross‐section). Left: agonist isomer (yellow); right: antagonist isomer (cyan). The methyl group at the chiral carbon atom of the ligand is shown in green (partially hidden behind the rest of the molecule in the antagonist). The back part of the 5‐HT1A receptor is represented in gray, and the location of the lipid bilayer is indicated by horizontal dotted lines. The central amino acid side chains F6.52 and W6.48 (green), together with the 3–7 lock (residues D3.38 and Y7.43), act as a gate, which after binding of the agonist undergoes a rotational switch (black arrows, left) to form a continuous water channel inside the receptor. Water molecules are depicted as bright yellow spheres, and red arrows (left) indicate the movement of water molecules after opening of the water channel inside the receptor.