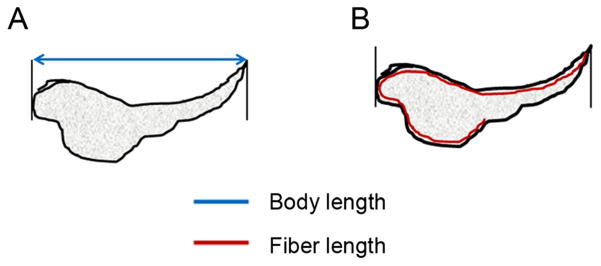
Figure 2.
Schematic diagram explaining the difference between the two morphological endpoints the Integrated Morphometry Analysis (IMA) module quantifies, fiber length (A) and body length (B), obtained from the high content screening (HCS) assay of zebrafish embryos. Fiber length is , where ‘p’ is the perimeter and ‘a’ is the area of the image.

