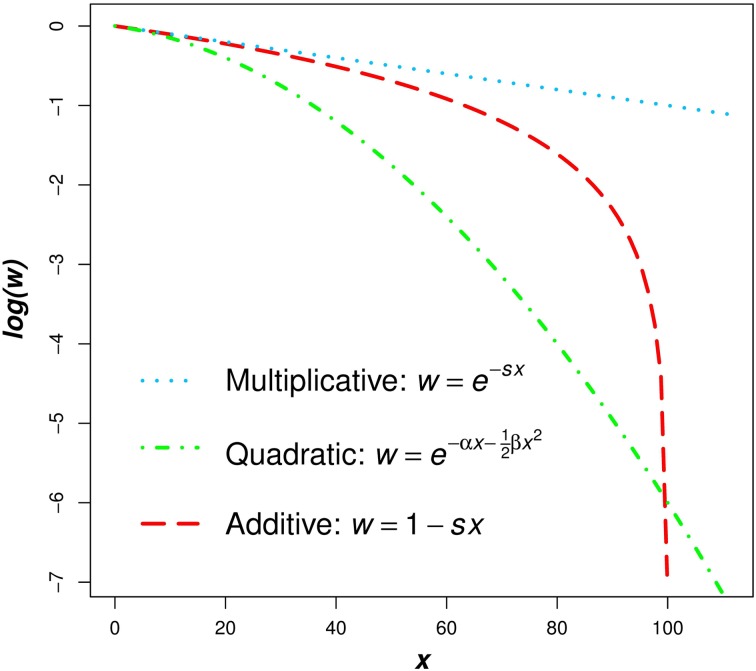
Fig. 1.
Comparison of the multiplicative, quadratic, and additive fitness functions on a natural-log scale. In these functions, w represents fitness and x represents mutation number. For the example functions depicted in the graph, s and α equal 0·01 and β equals 0·001. Under the additive model, all individuals where fitness 1−sx ⩽ 0 are undefined on a log scale. Because individuals cannot have negative fitness values, individuals where 1−sx < 0 are all assigned a fitness of zero in the additive model (see numerical iterations below).

