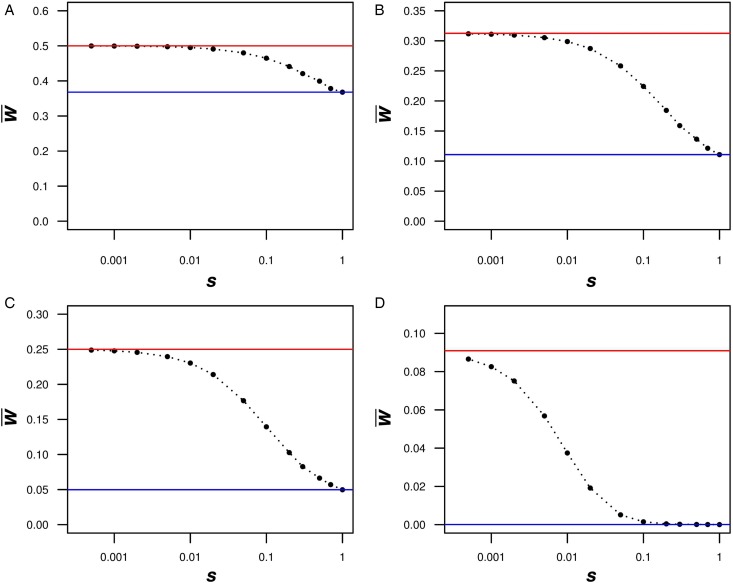
Fig. 2.
Numerical iterations of absolute fitness for varying degrees of s and U under additive fitness effects. A. U = 1, B. U = 2·2, C. U = 3, D. U = 10. The x-axis represents varying values of the selection coefficient (s) on a natural-log scale. The lower straight blue line represents the predicted average fitness  under multiplicative effects (
 ) and the upper straight red line represents the predicted average fitness under additive effects
  . Each dot represents the equilibrium average fitness from numerical iterations under a given s.

