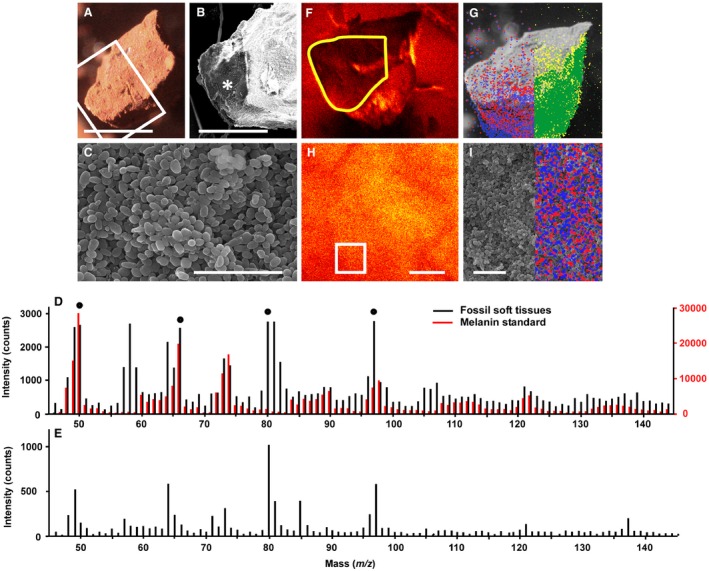
Figure 4.

Melanin in Miocene frogs from Libros. A–C, light micrograph (A) and scanning electron micrographs (B–C) of freshly fractured sample of soft tissues from MNCN 63663. B, detail of area indicated by box in A. C, detail of area indicated by * in B, showing densely packed, spheroidal to ovoid microbodies. D, negative ion ToF‐SIMS spectra for the region of the fossil tissue sample highlighted in yellow in F, and for a synthetic melanin standard; filled circles indicate ions used for ToF‐SIMS images in G and I. E, negative ion ToF‐SIMS spectrum for a sample of sediment from the area indicated by * in Fig. 1A. F, H, ToF‐SIMS images of total ion counts; F, sample shown in A; H, a selected region of the counterpart of the sample. G, I, ion images showing the distribution of ions derived from melanin (blue: m/z 50; red: m/z 66) and organosulfur compounds (yellow: m/z 80; green: m/z 97) superimposed onto scanning electron micrographs; G, is the sample in A; I, shows a detailed view of densely packed microbodies from the area indicated by a box in H; the signal is strongest in the lower part of the sample as this region was orientated towards the detector. Scale bars represent: 500 μm (A); 300 μm (B); 4 μm (C); 5 μm (H–I).
