
Fig. 2.
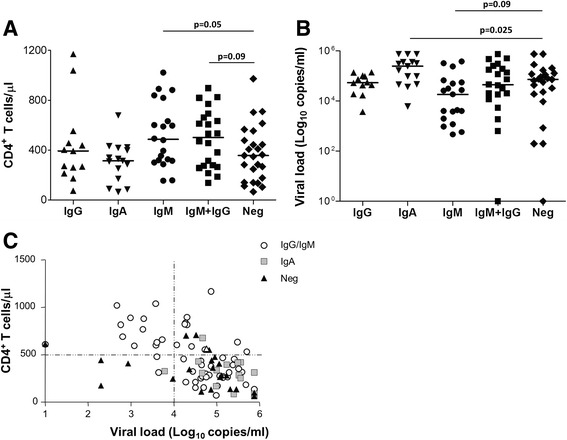
Association of anti-Tat antibody isotypes with CD4+ T cell count and viral load. Subjects were stratified according to the type and number of the anti-Tat antibody isotypes detected. Subgroups were compared for (a) CD4+ T cell count or (b) Log10 plasma viral load. Lines represent the median value. Statistical comparisons were made using the Mann-Whitney test. c Subjects were plotted according to both CD4+ T cell count and Log10 plasma viral load. Empty circles represent subjects with anti-Tat IgG and/or IgM but not IgA, grey squares represent subjects with anti-Tat IgA, black triangles represent anti-Tat antibody negative subjects