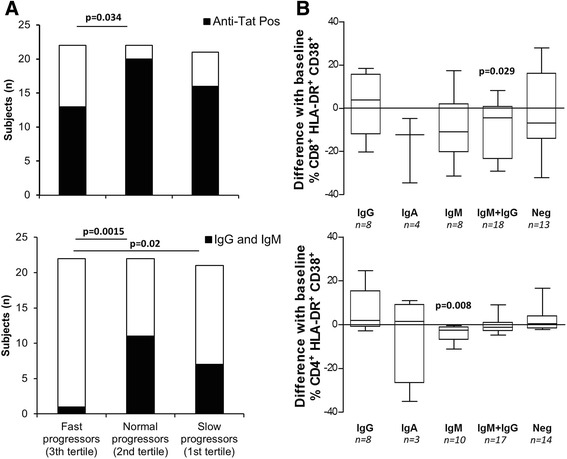
Fig. 4.

Association of different anti-Tat antibody isotypes with disease progression. a Subjects were stratified according to the tertiles of CD4+ T cell decline. Black bars represent subjects with any anti-Tat antibody isotype (top panel) or with anti-Tat IgG and IgM (bottom panel). Statistical comparisons were made using Fisher’s exact probability test. b Subjects were stratified according to the type and number of anti-Tat antibody isotypes. Subgroups were compared for absolute differences of CD38+HLA-DR+CD8+ T and CD38+HLA-DR+CD4+ T cell percentages. Absolute differences were obtained by subtracting baseline values from values collected at 1 year follow up visit. Data are presented as Box-and-Whisker Plots. Statistical significance of absolute difference was calculated using Wilcoxon signed rank test; p-values < 0.05 indicates that differences are significantly different from 0
