Fig. 1.

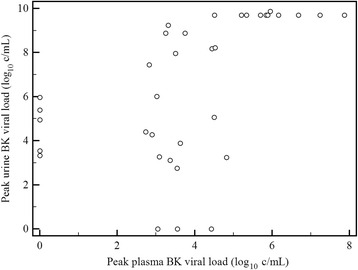
Correlation of peak plasma and urine BK viral load (log10 copies/mL). Legend: Correlation coefficient 0.53, 0.24–0.74 95 % CI, p = 0.001, y = 3.2119 + 0.8353×

Correlation of peak plasma and urine BK viral load (log10 copies/mL). Legend: Correlation coefficient 0.53, 0.24–0.74 95 % CI, p = 0.001, y = 3.2119 + 0.8353×