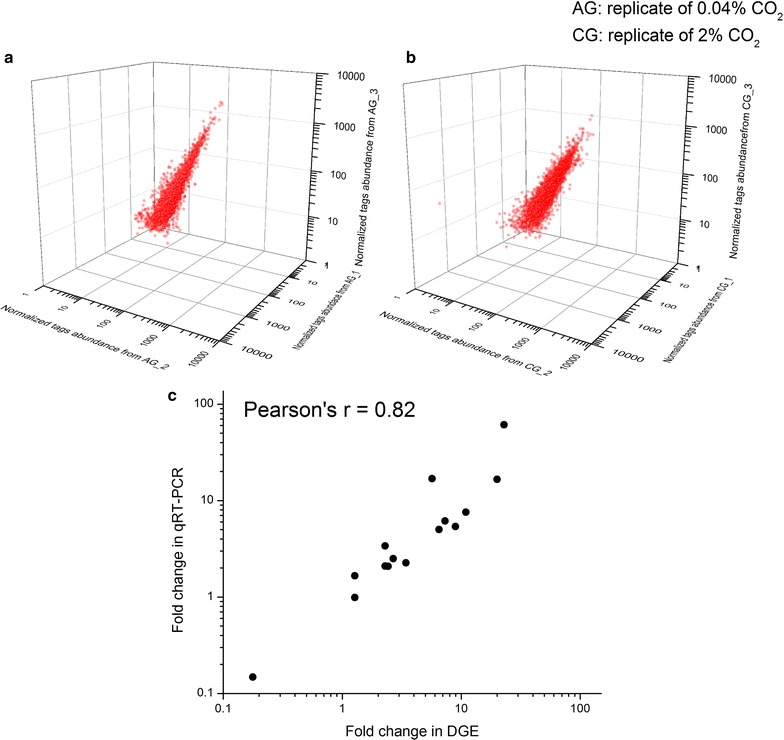
Fig. 2.

Reproducibility and reliability of the transcriptomic data. a, b The 3D scatter plots of normalized transcripts reads abundance. High correlations among three biological replicates of AG (0.04 % CO2) (a) and CG (2 % CO2) (b) indicated high degree of reproducibility of transcriptomic data. c DGE data were validated by quantitative RT-PCR via Pearson’s correlation coefficient
