
Fig. 2.
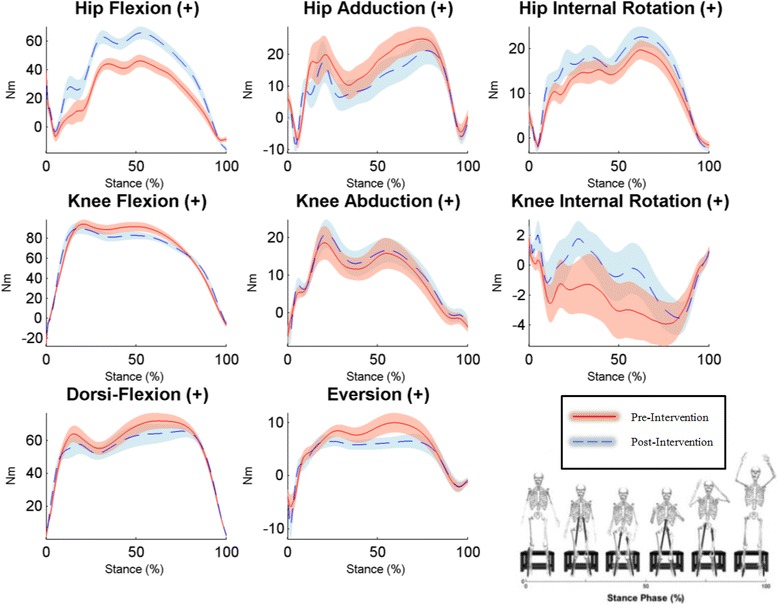
Time series plots of kinetic variables during the stance phase of the DVJ pre- and post-intervention. Graphical representations of the mean performance (represented by solid/broken lines) and (±) SEs (represented by shaded areas) for participants pre- and post-intervention, respectively. Non-overlapping SEs represent significant group differences