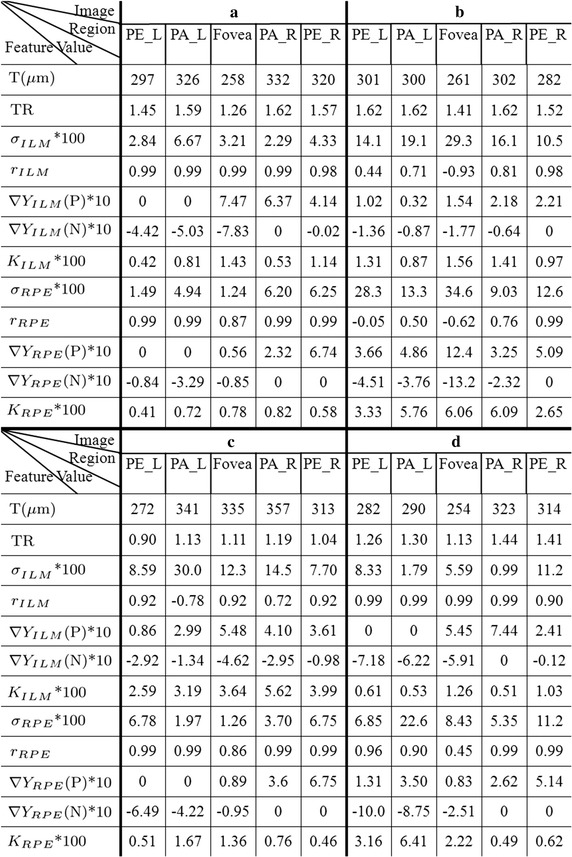
Fig. 11.

The features quantitative calculation results. The rough abnormities from the boundaries comparison are shown in Fig. 7 and more accurate judgment can be obtained by boundary structure quantification and data features. This figure shows the corresponding quantitative values in different regions and different features. a–d are respectively corresponding to the four original images in Fig. 8
